*** This version of Confluence is for testing only and contains a copy of content from June 29th 2026. No changes will be preserved. ***

 user-3cacb, last updated on Feb 27, 2008
2 minute read
user-3cacb, last updated on Feb 27, 2008
2 minute read
February 27, 2008
Another set of data has been evaluated. The alum dose for this particular experiment was 40mg/L and the clay dose turbidity was set at 125NTU.
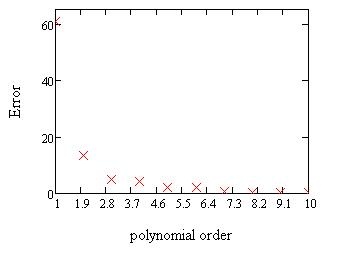
Polynomial regression was evaluated on the raw data. The logarithmic regression was done for comparison purposes. However the equation for logarithmic regression was nonlinear.
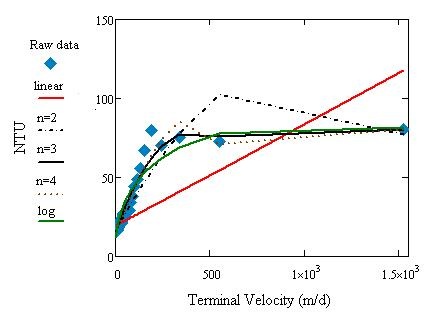
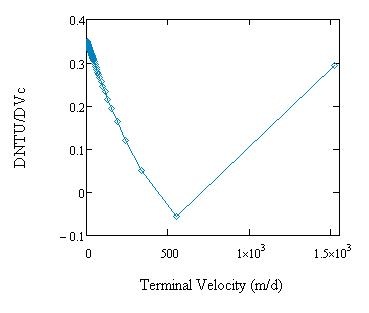
Polynomial degree of 3 (n=3) was chosen in this particular set of data and the slope of the curve is plotted below.
 of polynomial (Plots not shown) - not consistent