*** This version of Confluence is for testing only and contains a copy of content from June 29th 2026. No changes will be preserved. ***

 user-e924c, last updated by user-f25a2 on Jul 08, 2009
2 minute read
user-e924c, last updated by user-f25a2 on Jul 08, 2009
2 minute read
Previous research indicated that an alum dosage of 45 mg/L is considered to be ideal. This preliminary data is the base for further research. The graphs below show the effluent turbidity plotted against time for capture velocities of 0.058, 0.116, 0.174, and 0.231 mm/sec. 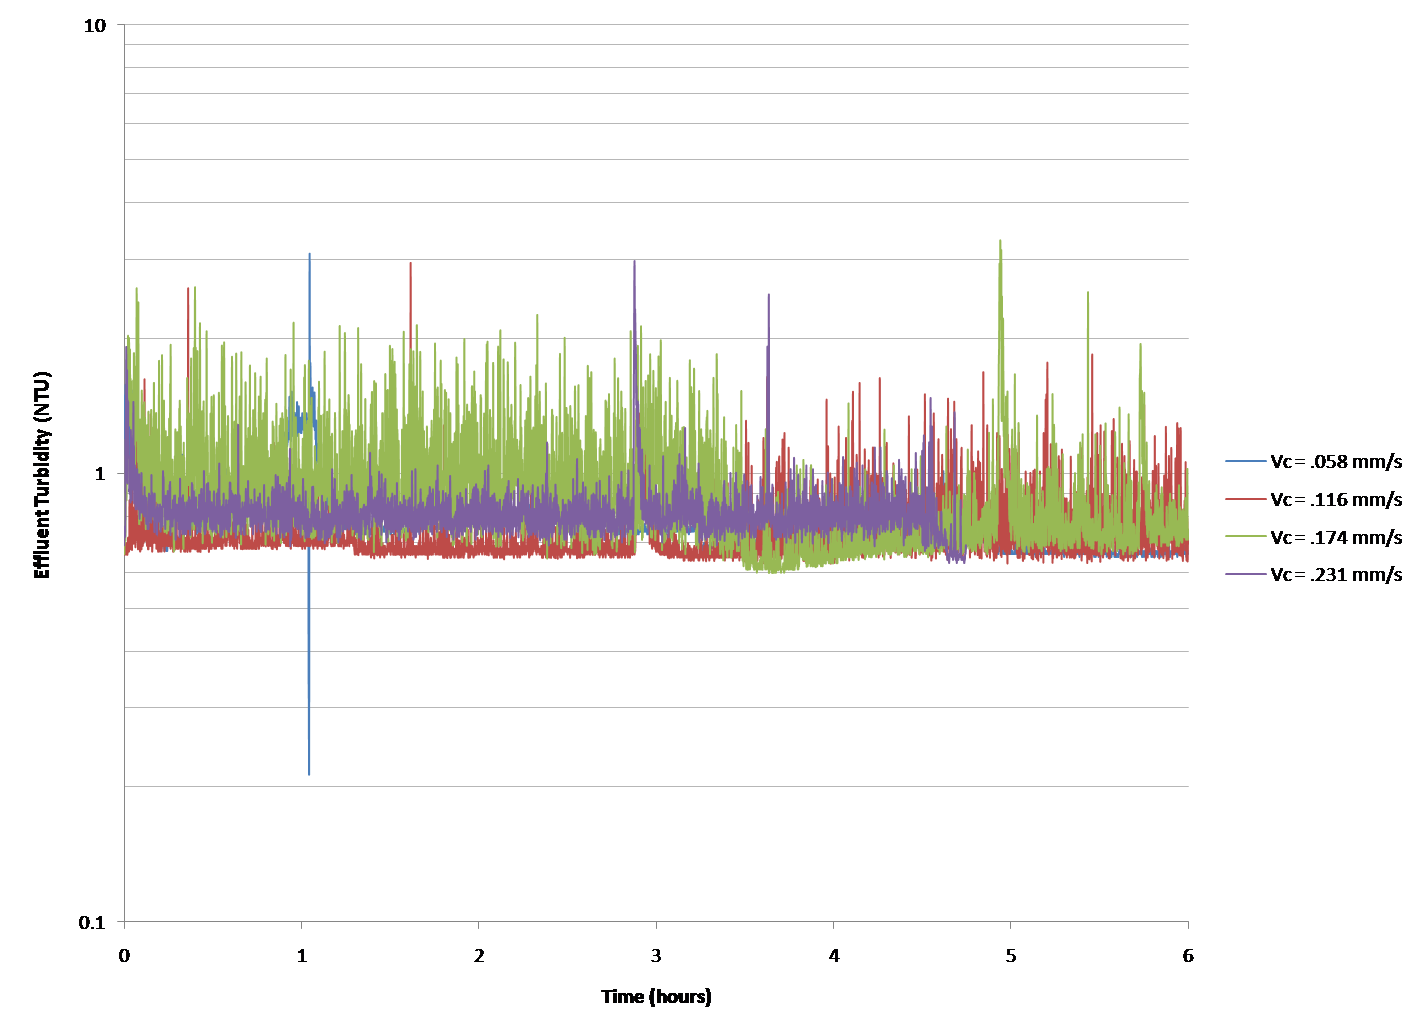
Figure 1: Effluent Turbidity vs. Time for Floc Blanket on low, alum dose = 45 mg/L
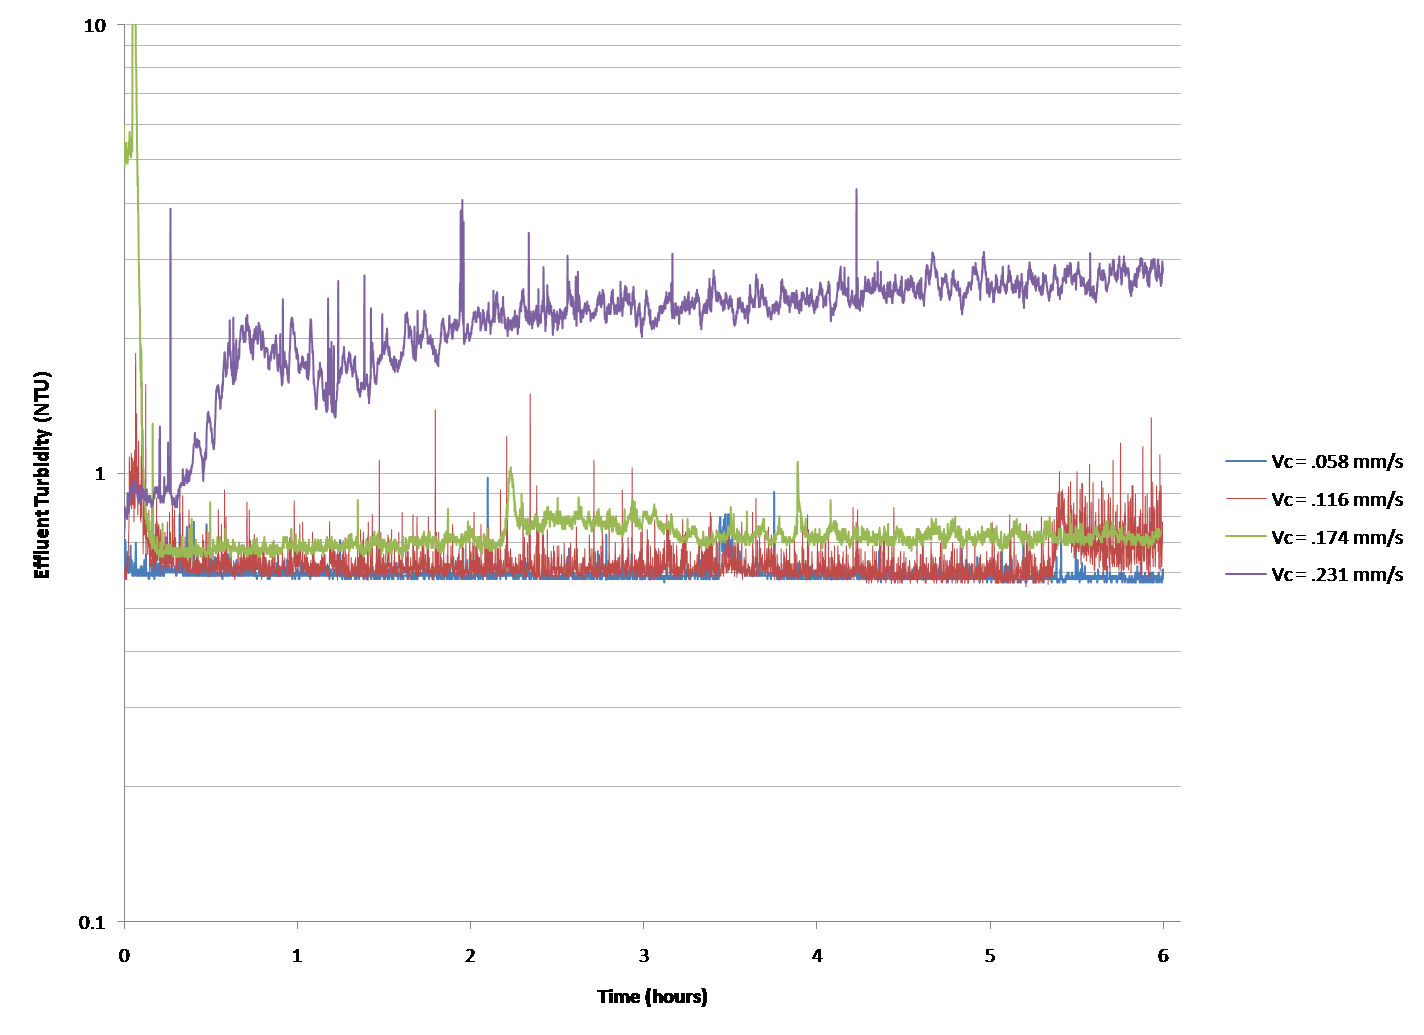
Figure 2: Effluent Turbidity vs. Time for Floc Blanket on high, alum dose = 45 mg/L
With both a low and high floc blanket, an average effluent turbidity less than 1 was achieved for all capture velocities except for 0.231 mm/sec with a high floc blanket. There was an overall trend of lower average effluent turbidity with lower capture velocity.
It is expected that the effluent turbidity will increase with a higher capture velocity. This is evident in both graphs, as the general pattern of the data for all four capture velocities demonstrates this trend. In the high floc blanket state, for 0.231 mm/sec, the highest capture velocity that was tested, the effluent turbidity is significantly higher than the other three capture velocities. The curves do not follow the pattern of those in the low floc blanket state, where the overall trends for each capture velocity only differ by a small amount over the course of the six hour experiment. This unexpected data requires more investigation and testing to ensure that it is accurate.