*** This version of Confluence is for testing only and contains a copy of content from June 29th 2026. No changes will be preserved. ***

 user-9c36d, last updated on Feb 05, 2008
1 minute read
user-9c36d, last updated on Feb 05, 2008
1 minute read
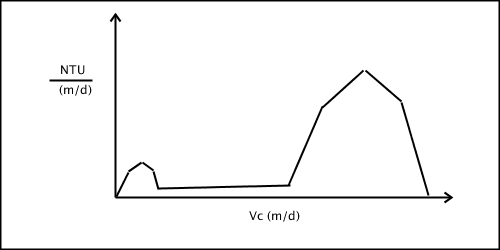
We could characterize a suspension of flocs based on the terminal velocity of the flocs and on the turbidity of the narrow ranges of particle size. Since the particle size will be measured in terminal velocity, the narrow ranges of particle size will also have dimensions of velocity. Thus the y axis will have units of NTU/(m/s). The x axis has units of m/s, and the area under the curve is thus the total turbidity of the suspension. A suspension with a small number of very small particles and a large number of large particles is shown in the figure.
If this suspension were in a column that was monitored by a turbidimeter, the fast settling particles would settle past the turbidimeter first and then much later the small particles would settle past the turbidimeter sensor. Thus the turbidity vs time plot is shown below.
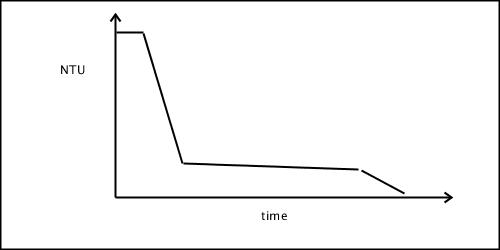
The time on the x axis can be converted into a terminal velocity based on the distance between the top of the column and turbidimeter sensor.