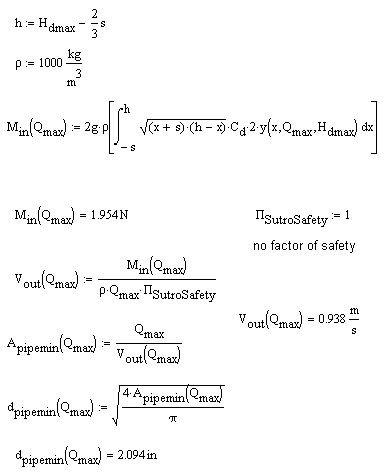
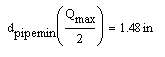
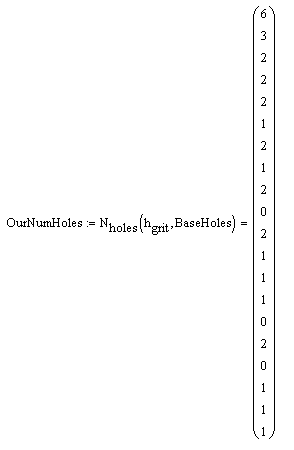
The Point of failure experiment will evaluate the point at which the diameter of the LFOM is too small to accomodate the flow throuhg the riser pipe. At a certain point the water will back up in the pipe and then there won't be free flow from the orifice into the riser pipe. The small diameter riser pipe will be tested at the pilot plant. The hypothesized results are a relationship taht is the same as the tearget realationship until failure and then a slope that is more vertical than the target line. The results showed a linear relationship that is more vertical than the target values for all flow rates.
In order to more accurately calcualte the optimal LFOM diameter it is necessary to know the point at which the diameter is to small and will achieve failure. The point of failure experiment will test a prototype design under predicted failure conditions. The point of failure is predicted assumeing a conservation of momentum.
The documentation of the program used to for these calcualtions is available here
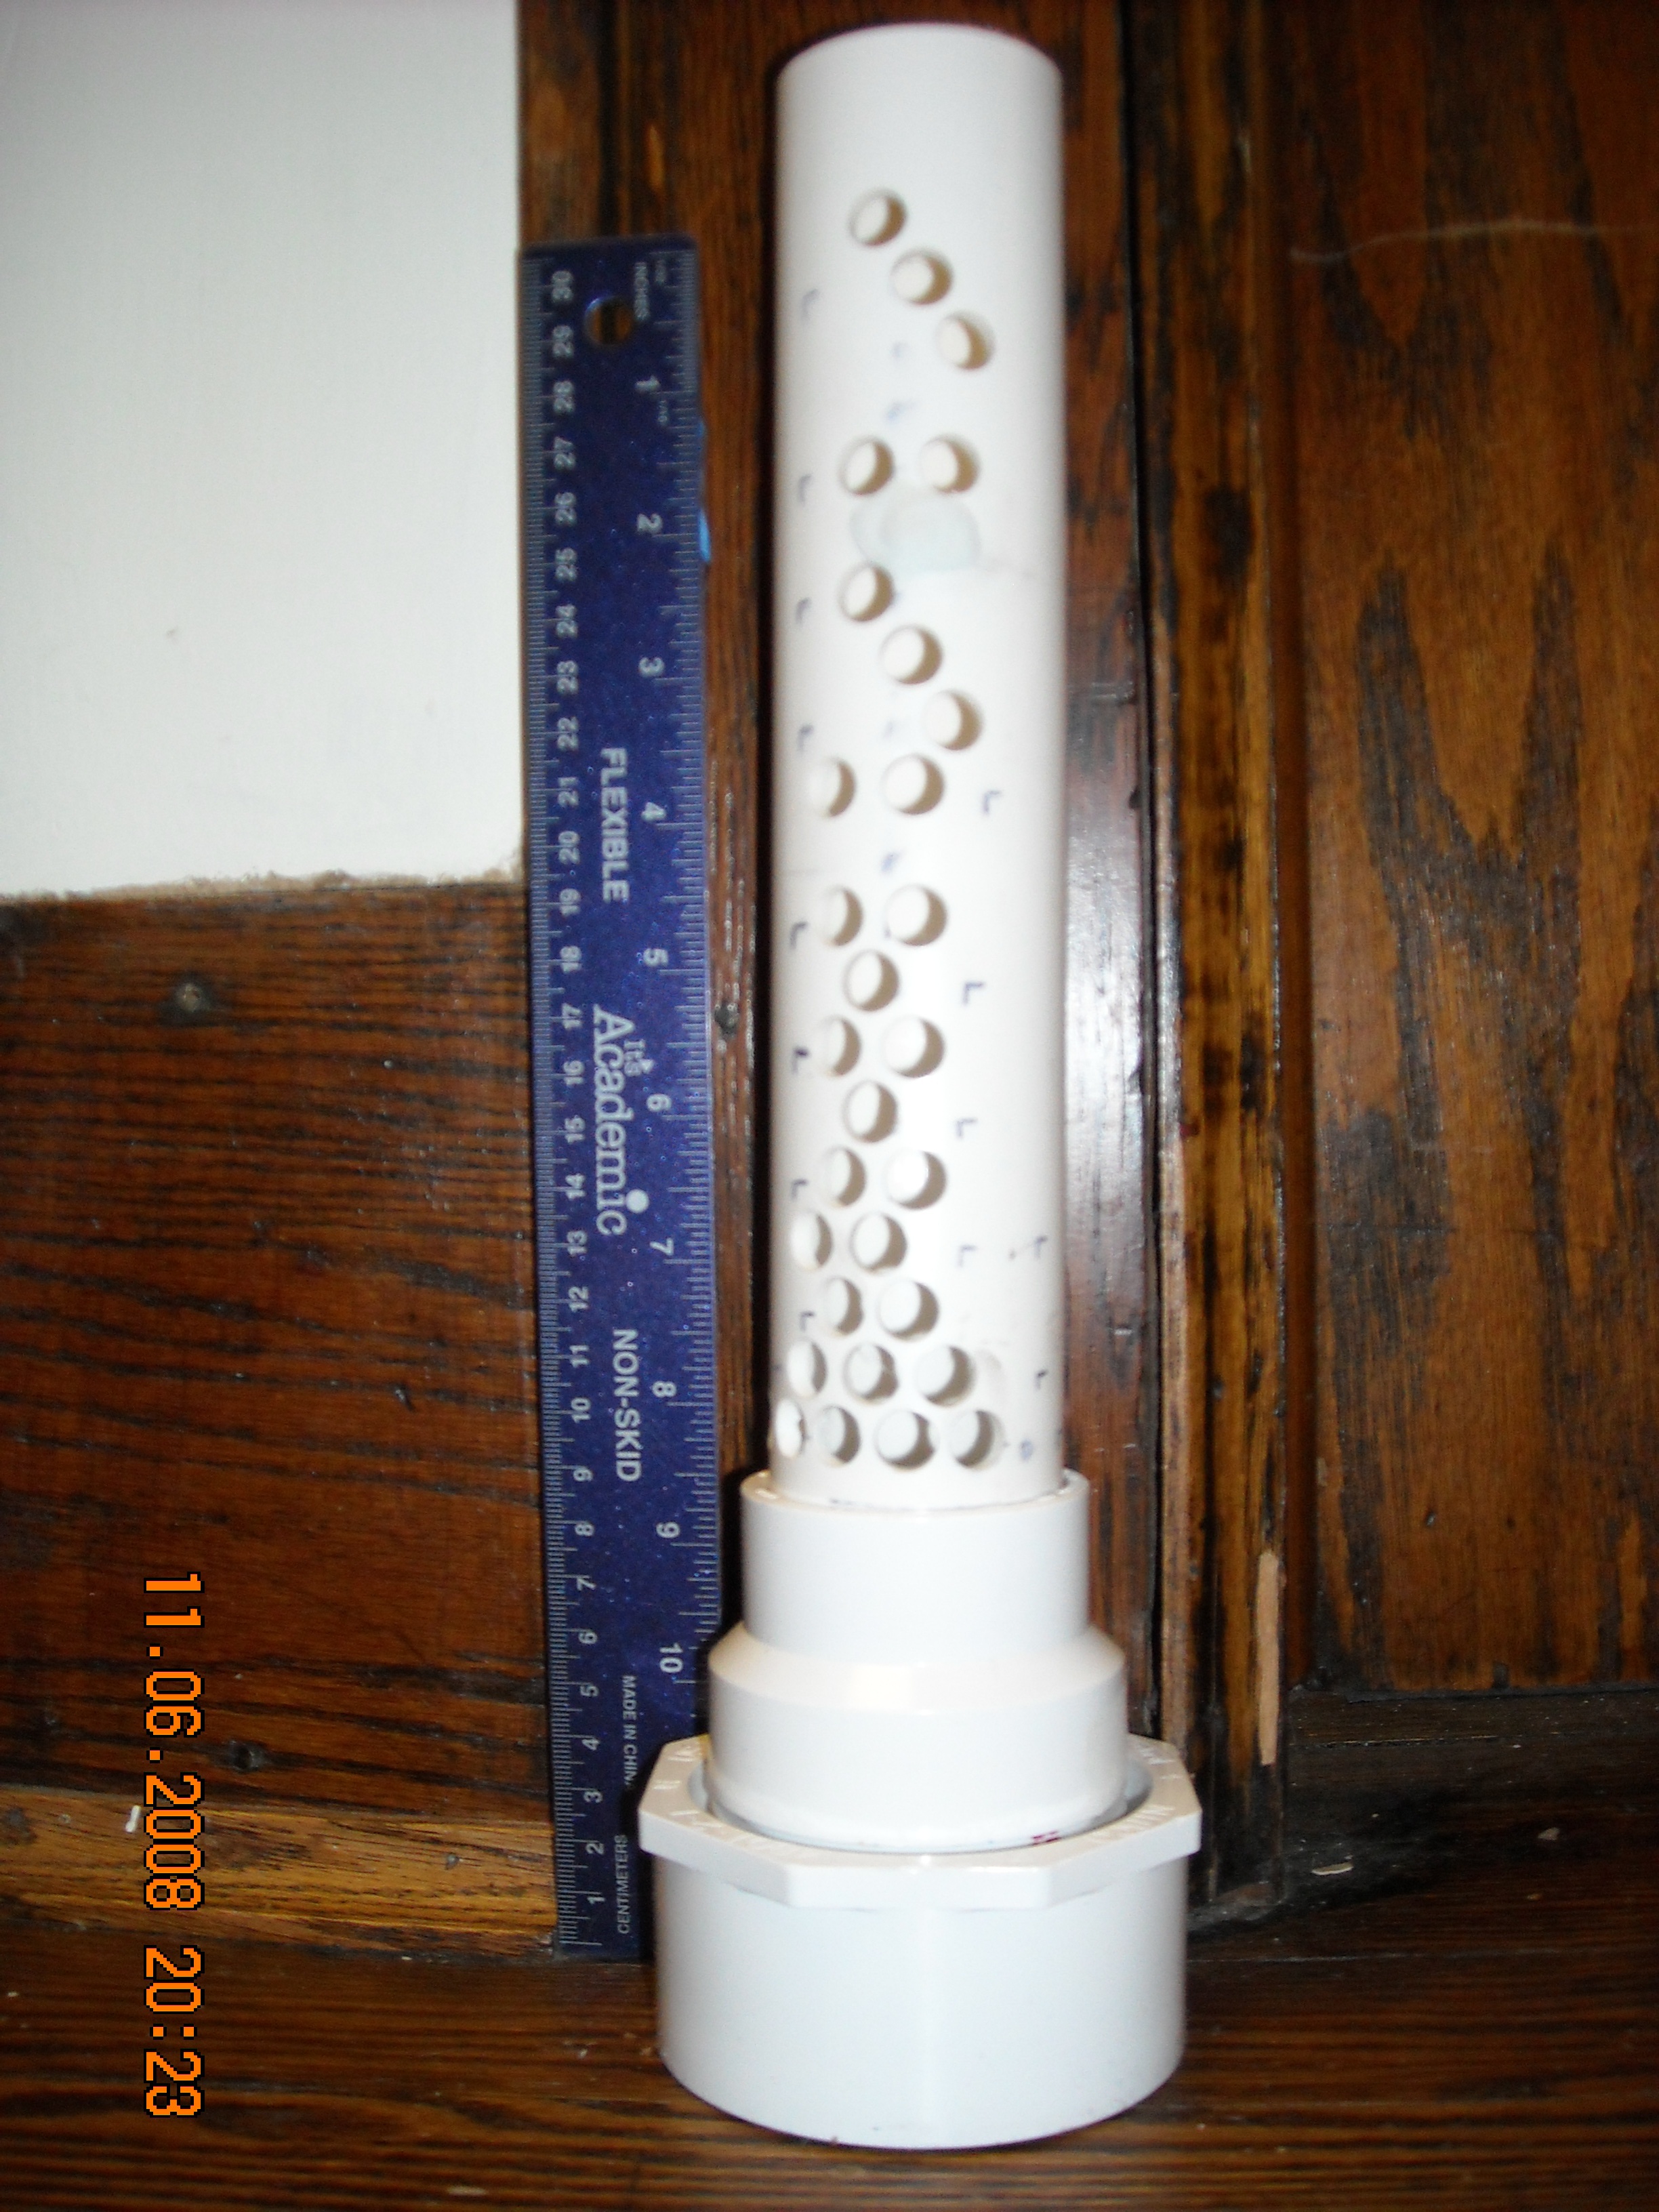
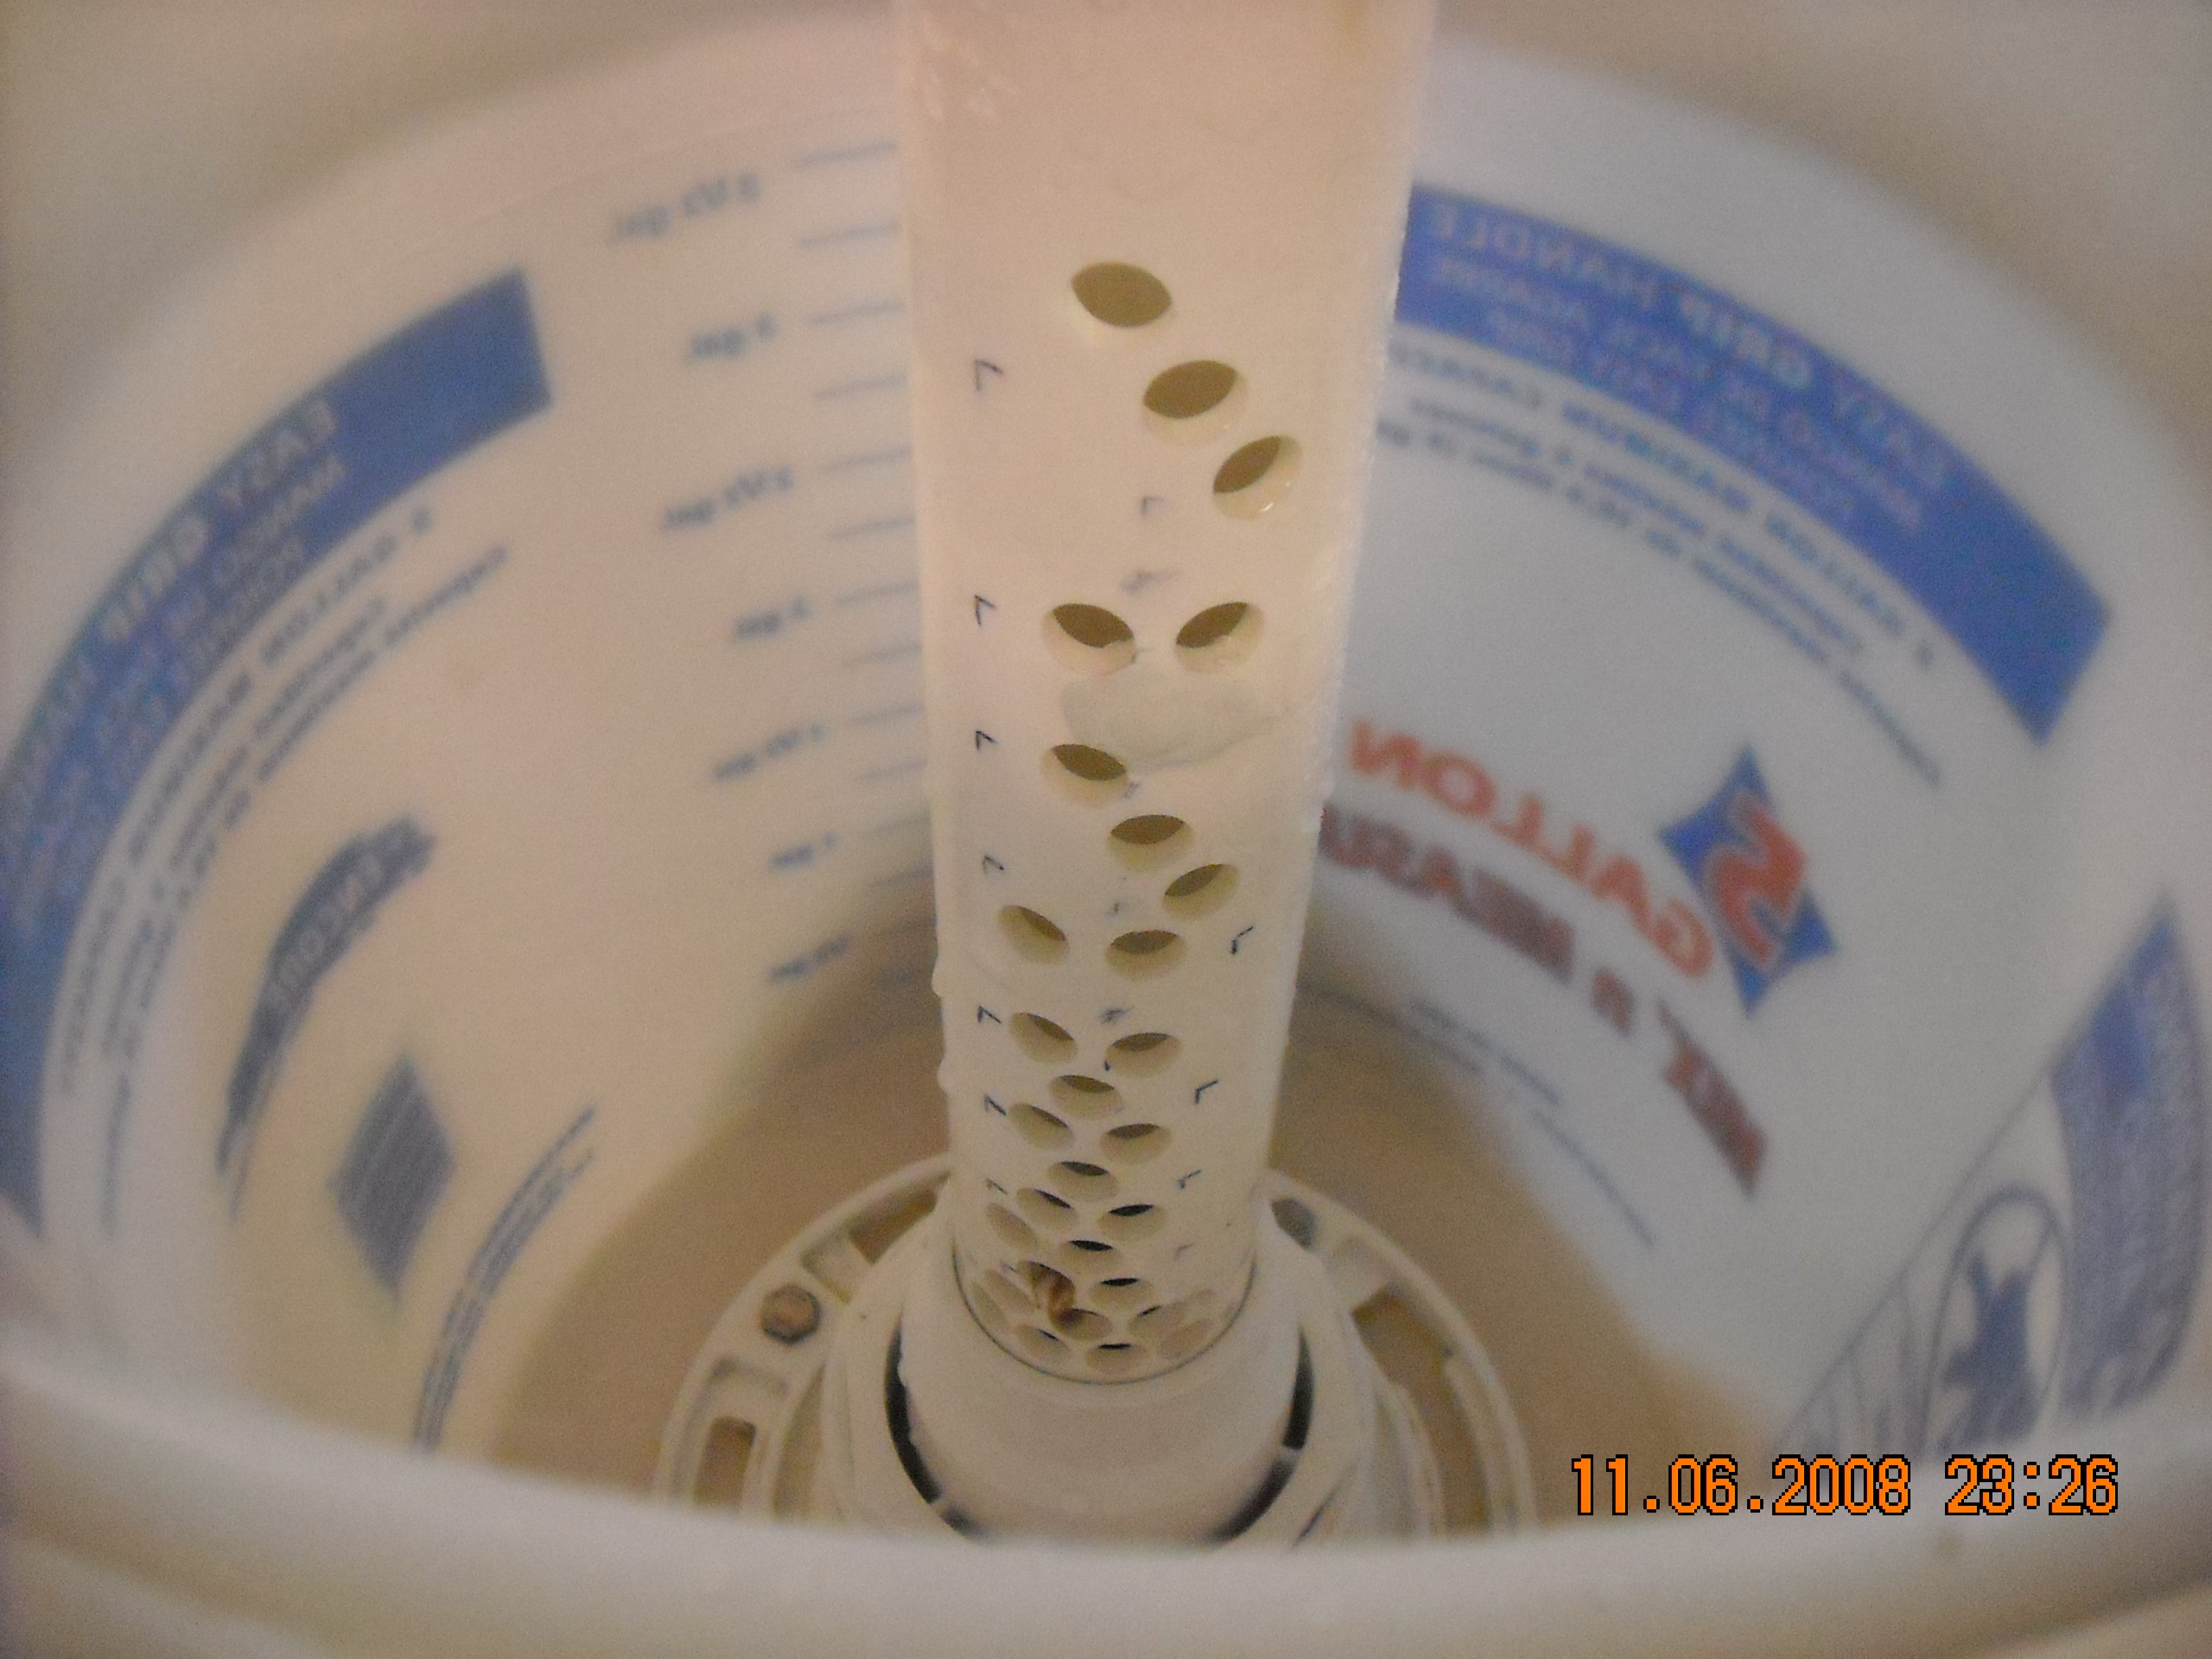
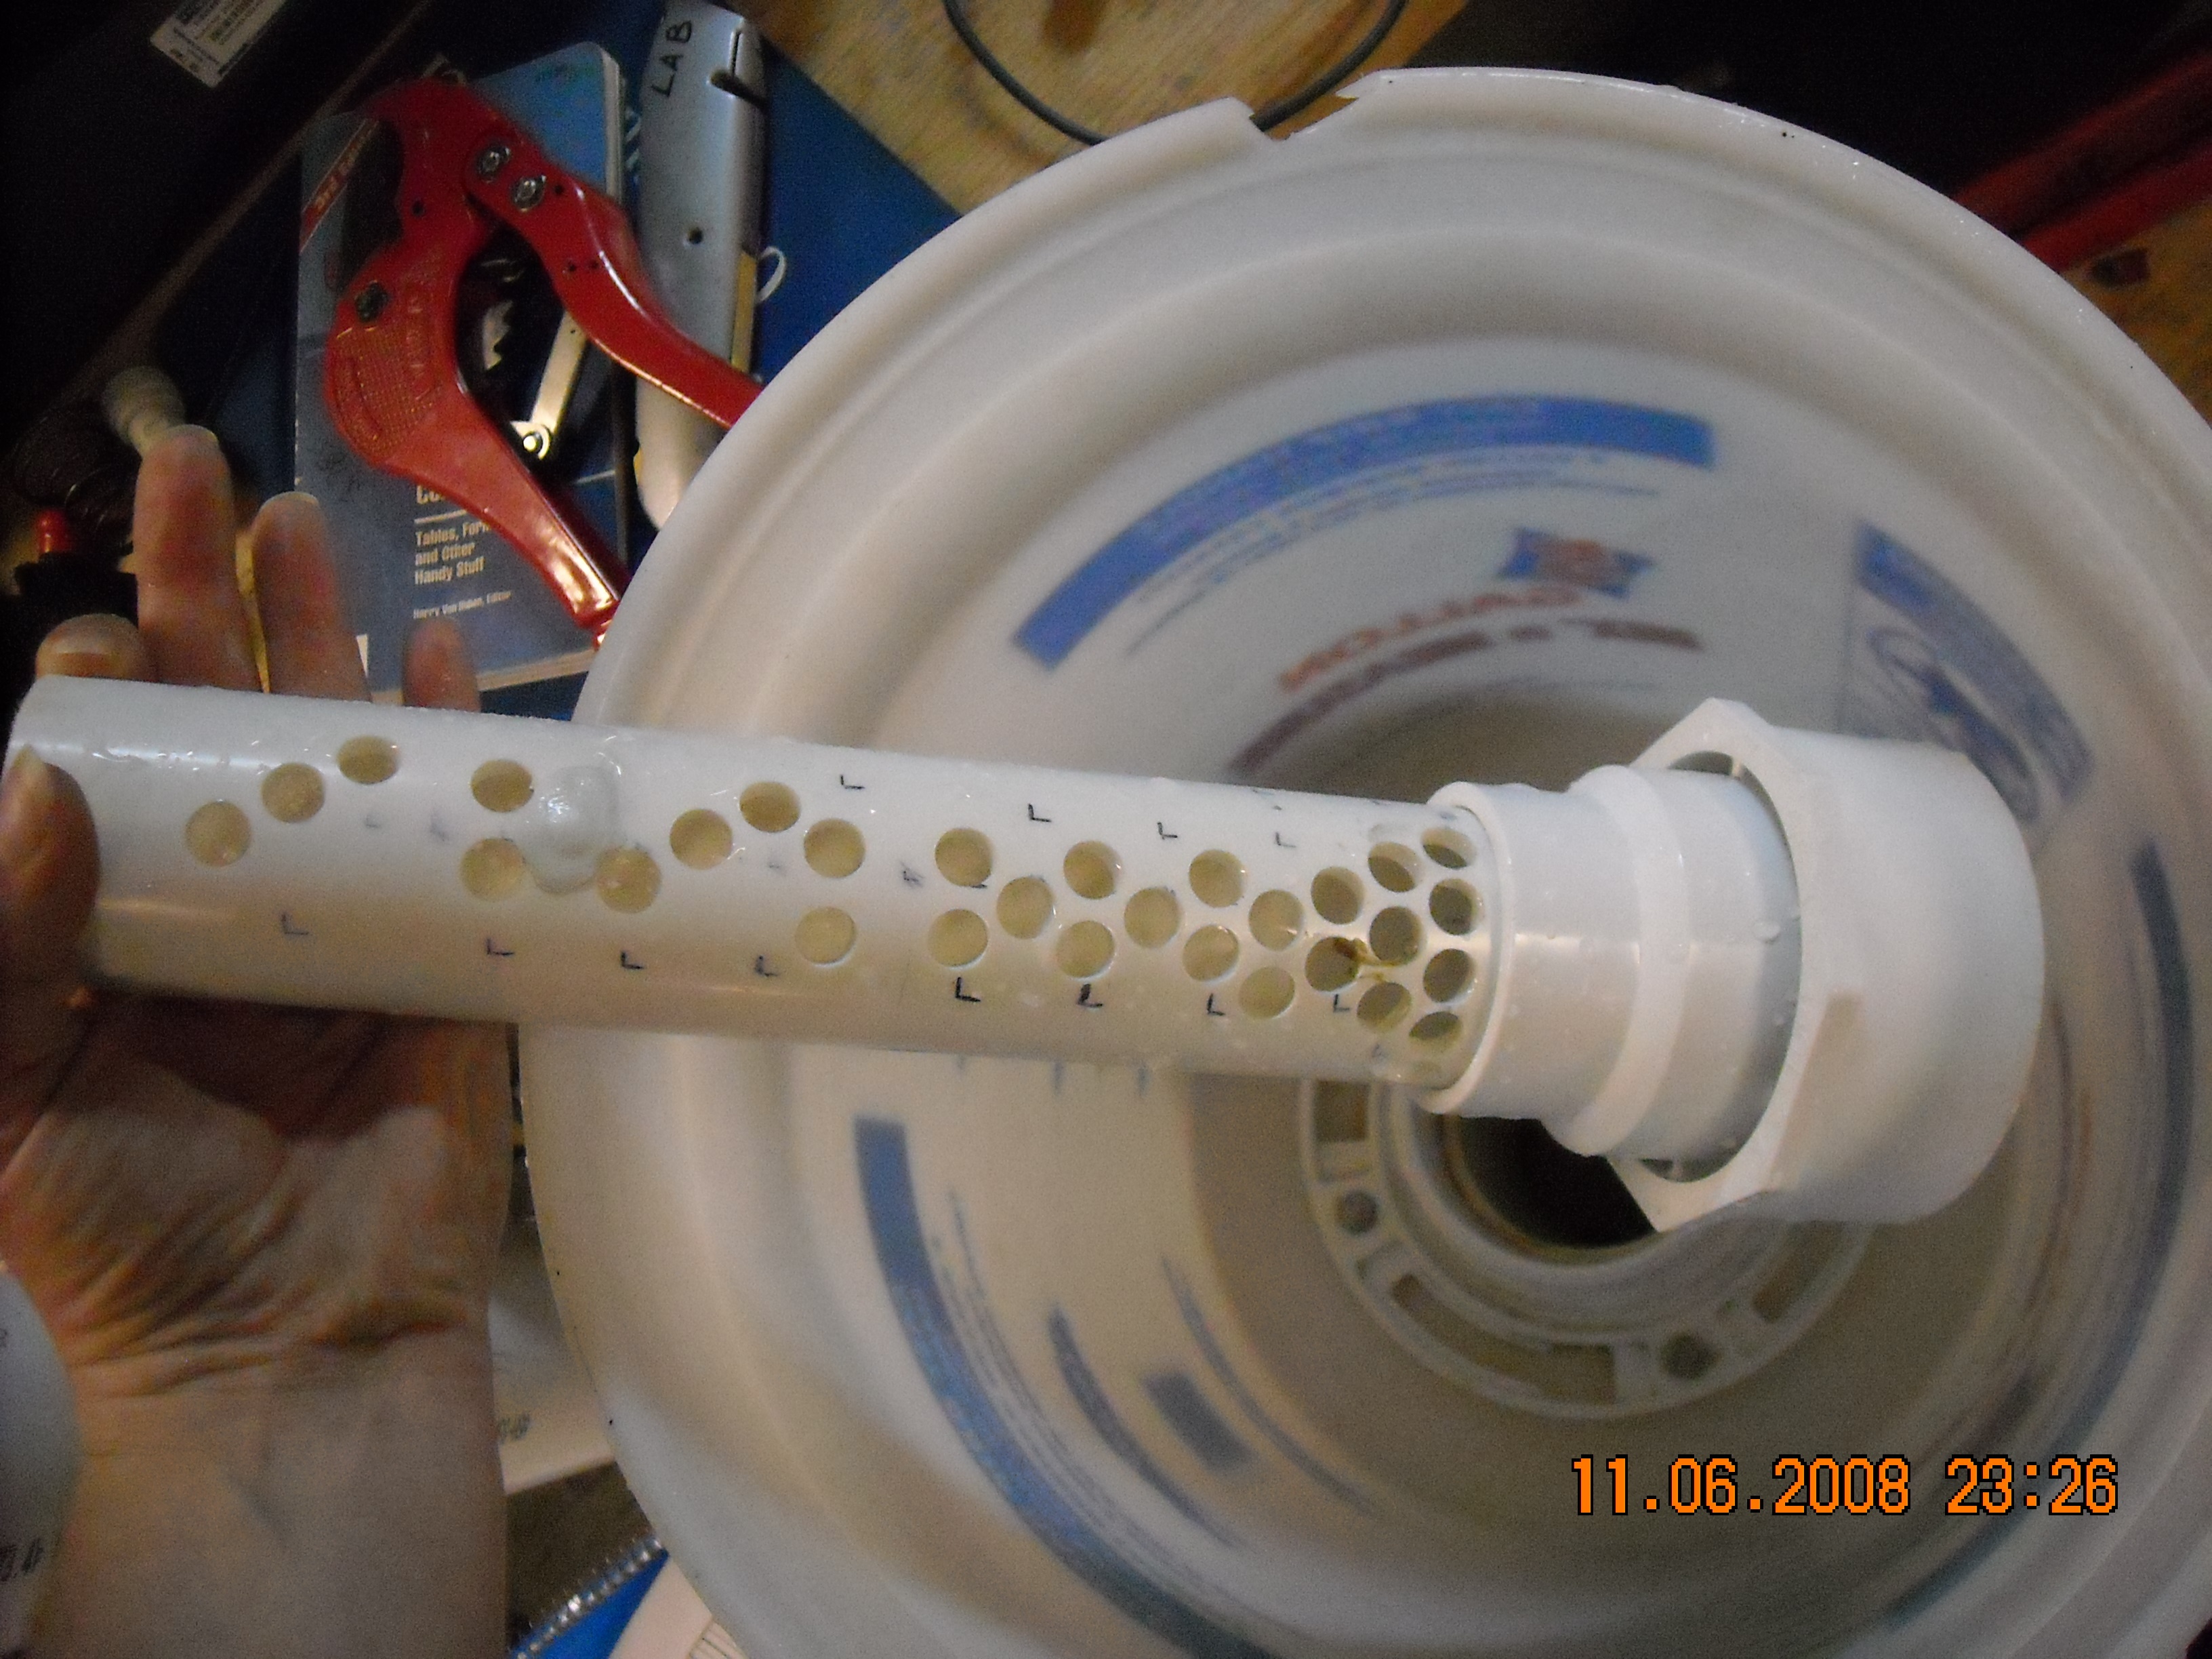
The completed design is shown below. The original entrance tank was used and a series of reducers were used to connect the smaller diameter pipe to the existing hole (that was created for the 3" diameter riser pipe).
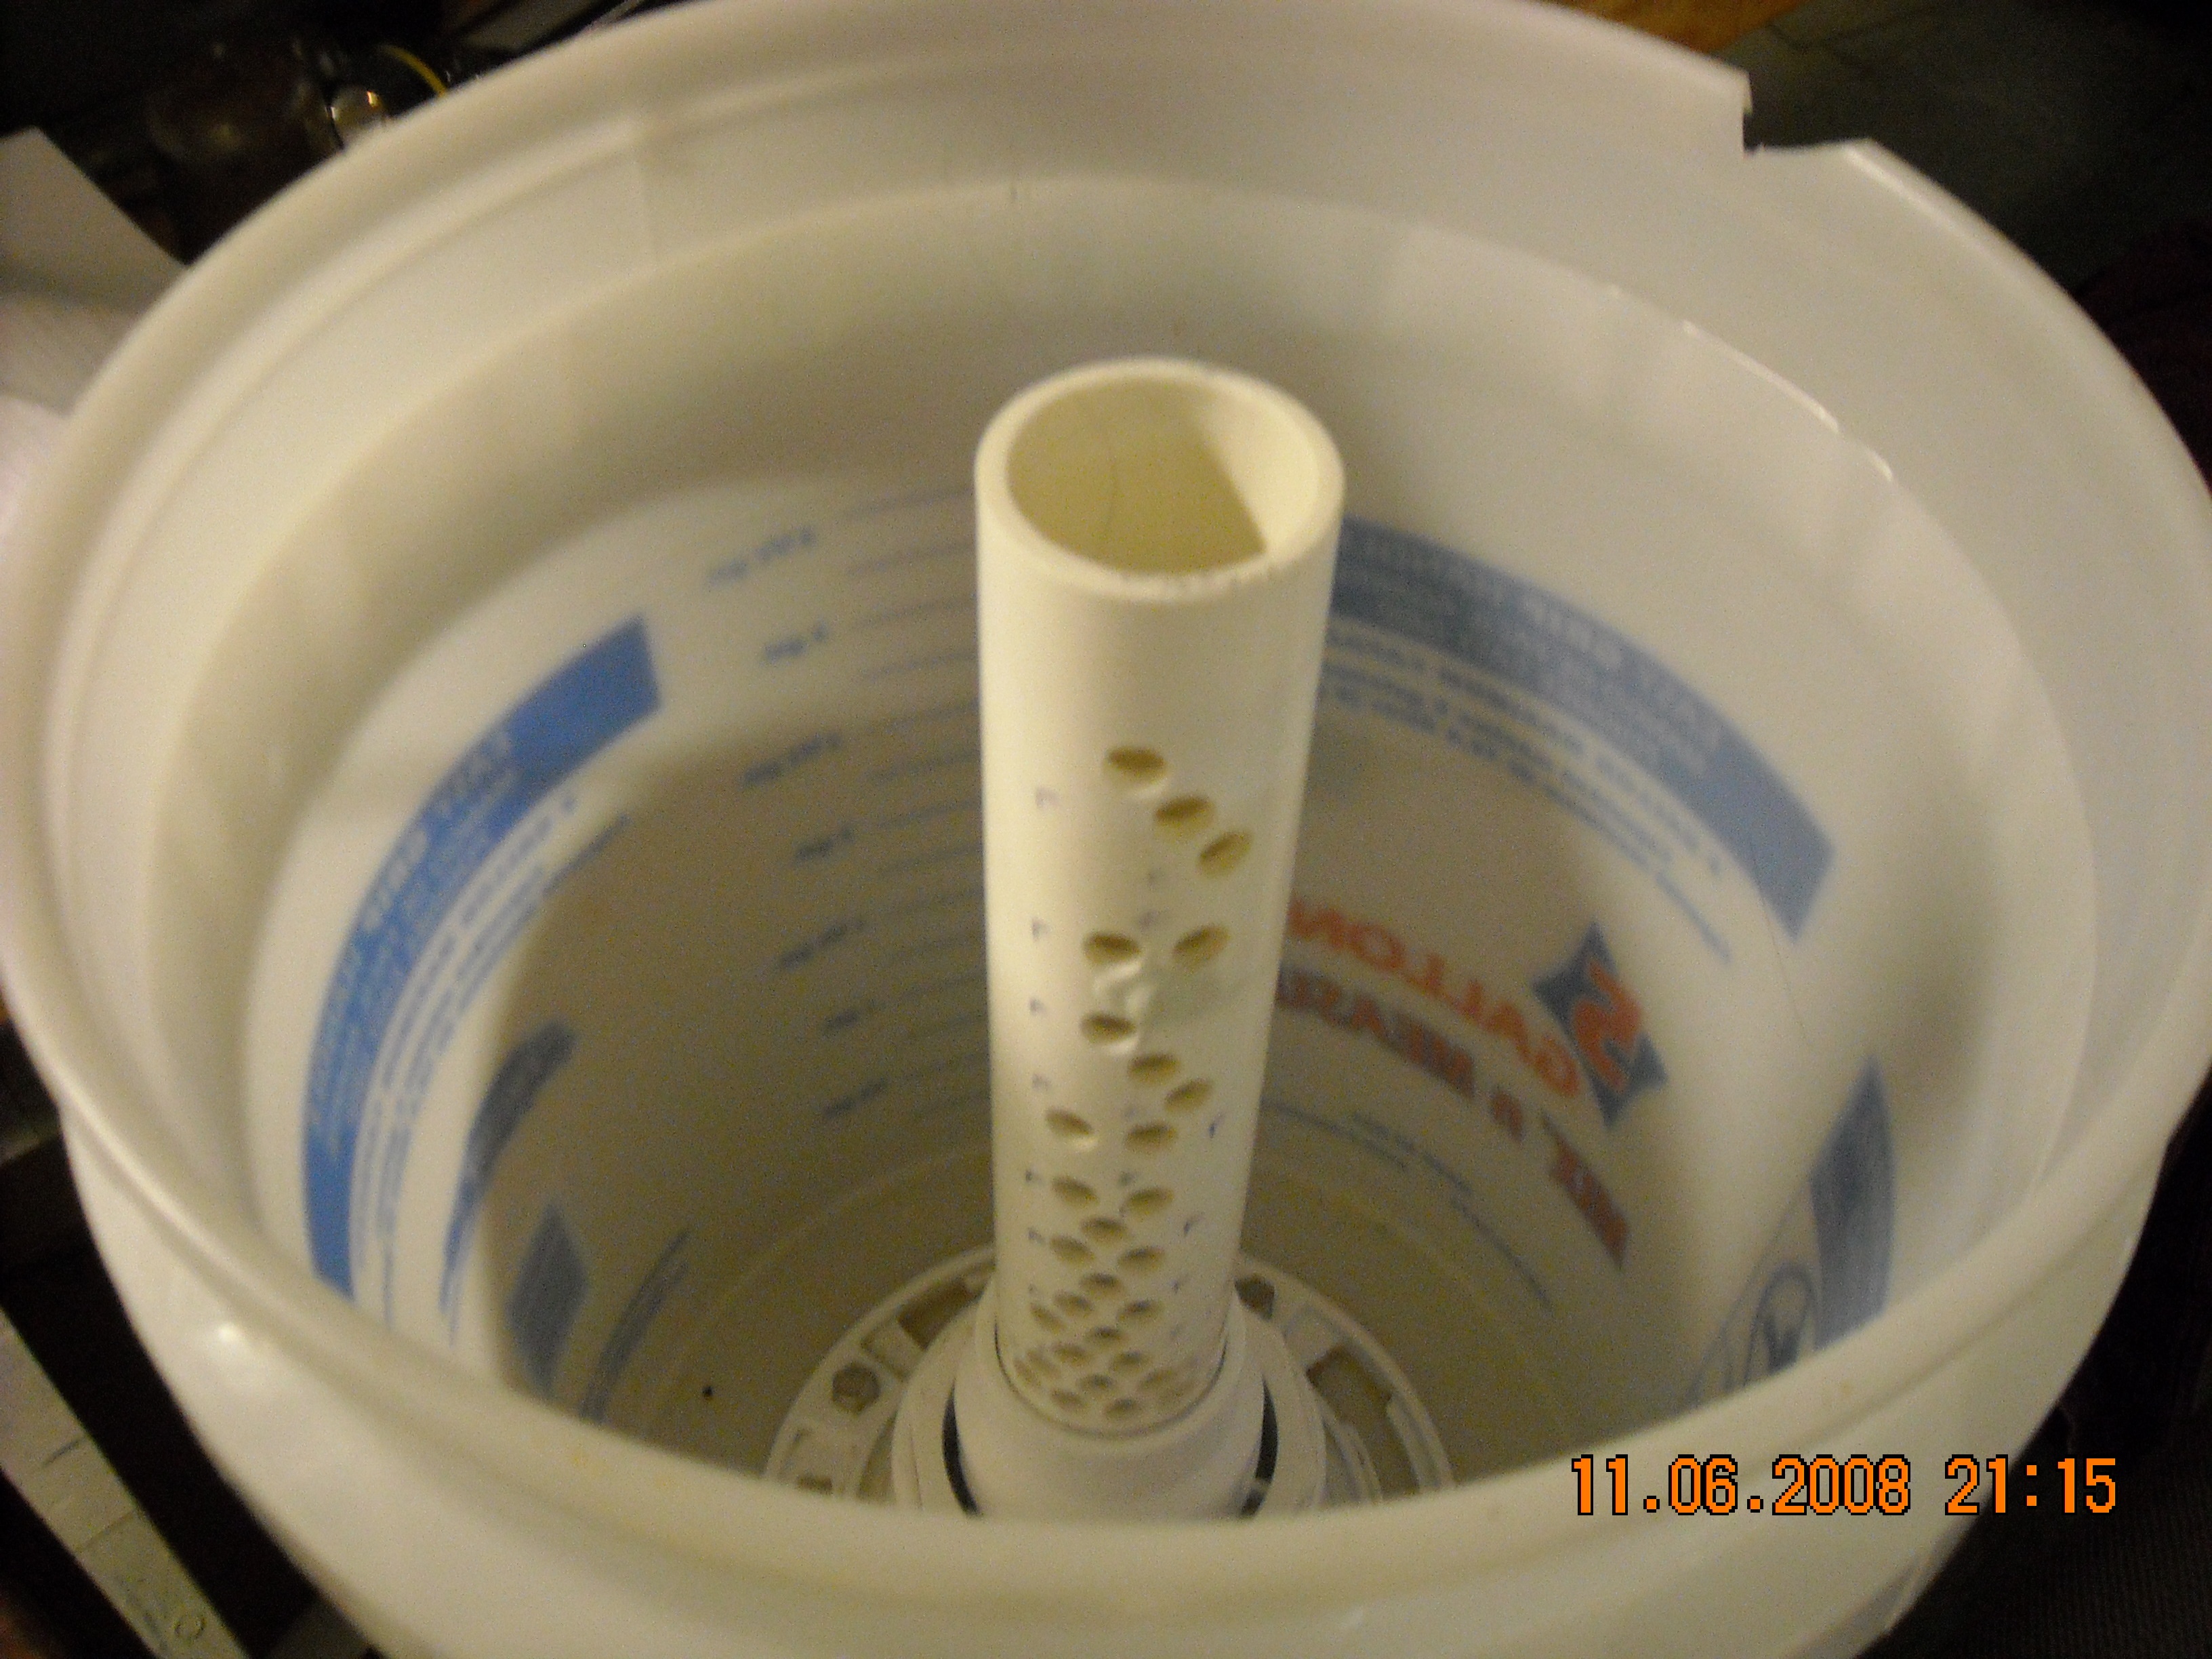
The entrance tank with riser pipe was installed in the plant and measurements were taken on the efficiency and accuracy of the design. There is an in-line flow meter that will provide flow rate data that can be compared to the flow rate recorded based on height in the entrance tank. There will be readings at incremental flow rates where the machine flow rate and water height will be recorded.
1) Check that ALL holes are clean and free of obstructions
2) Record the flow rate from the flow meter in GPM
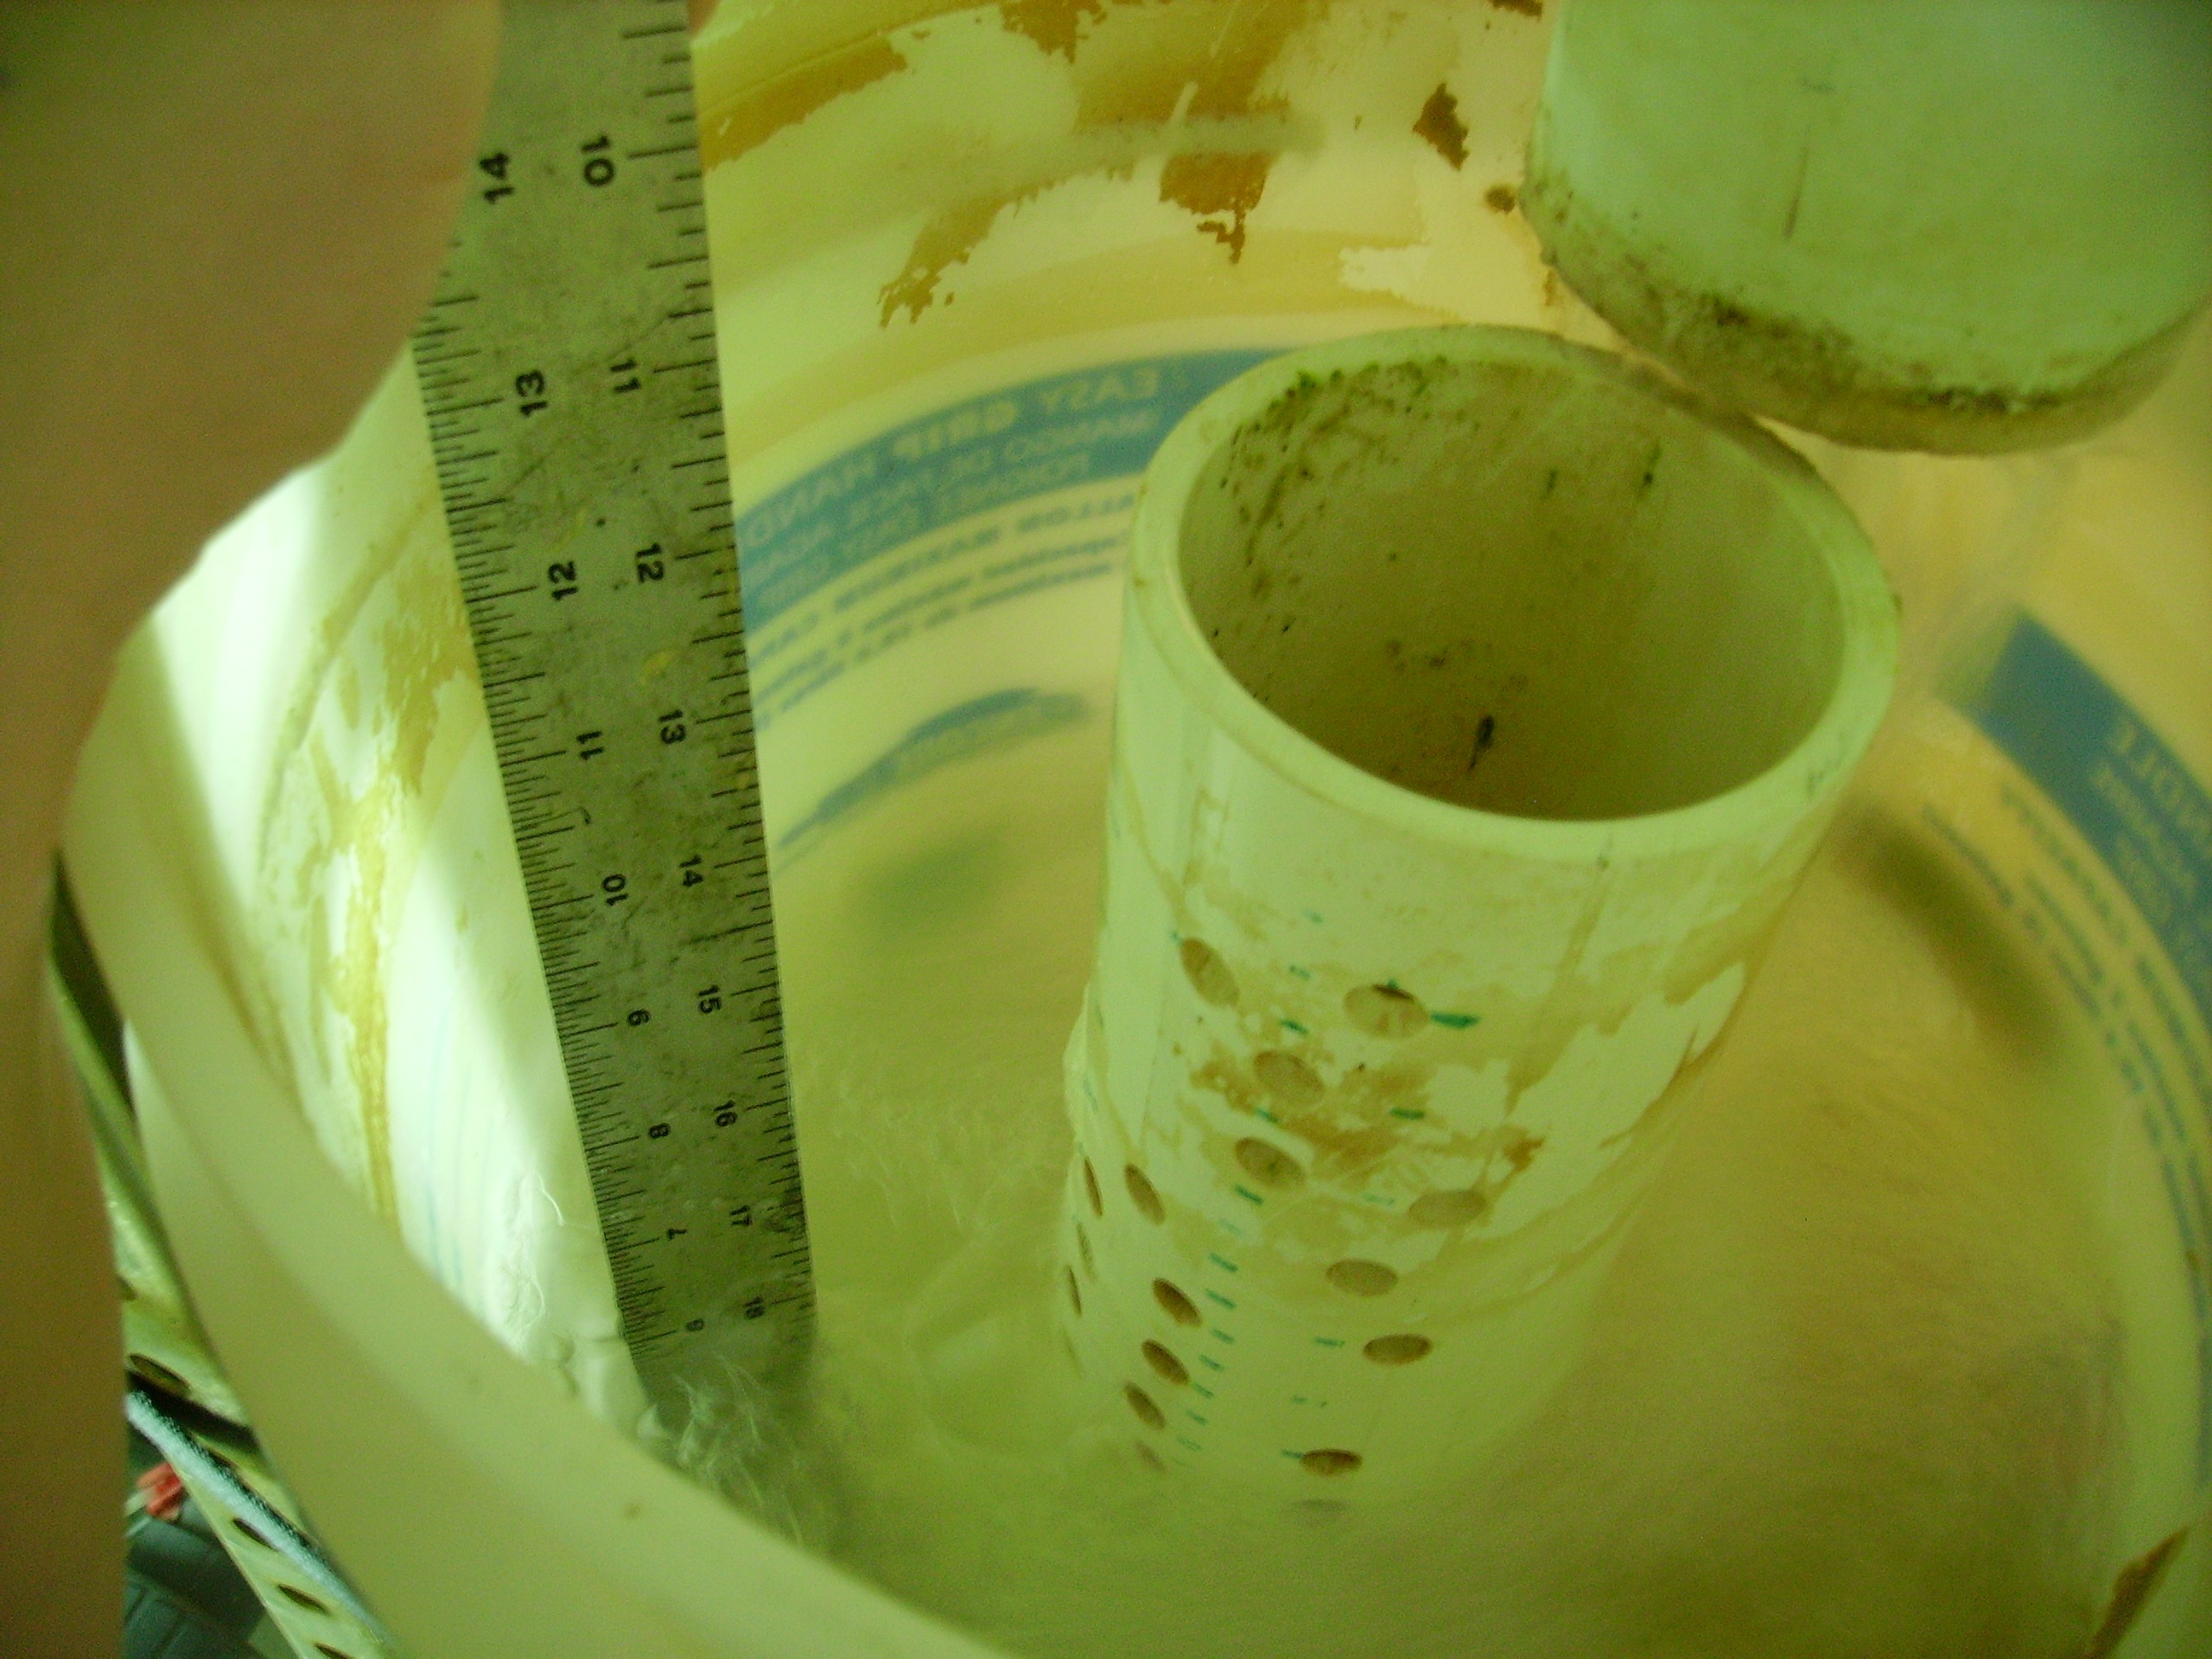
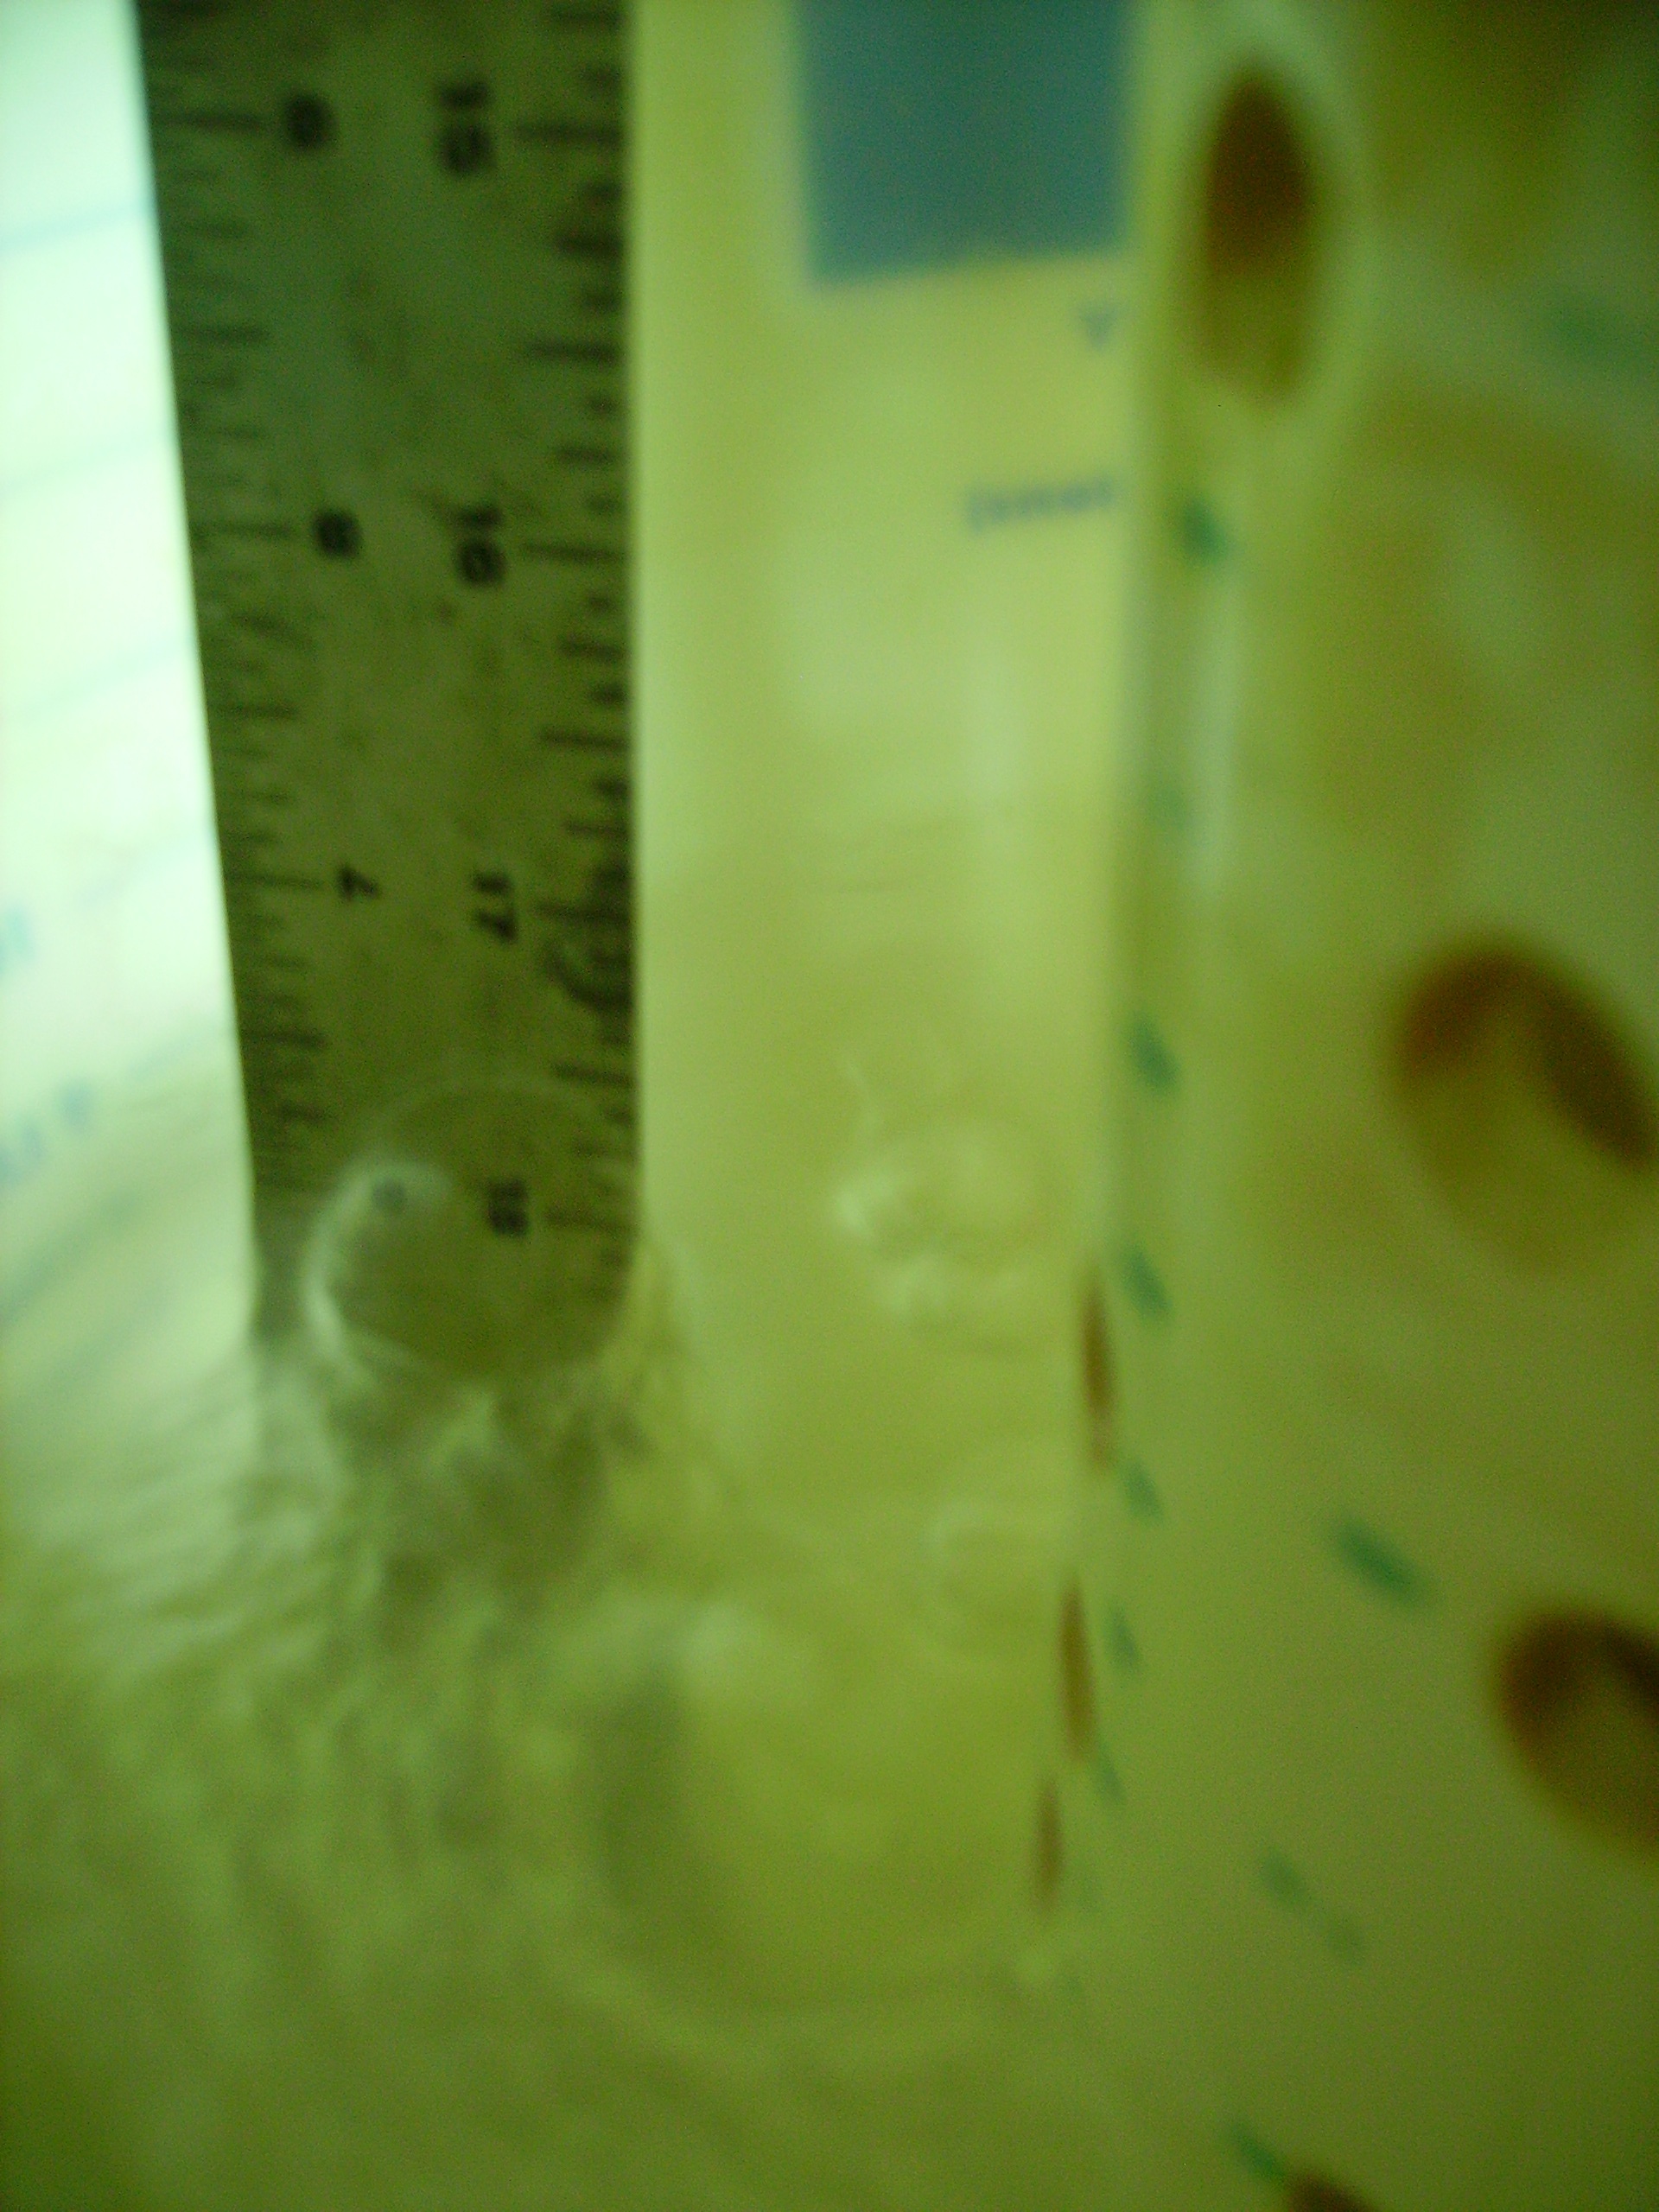
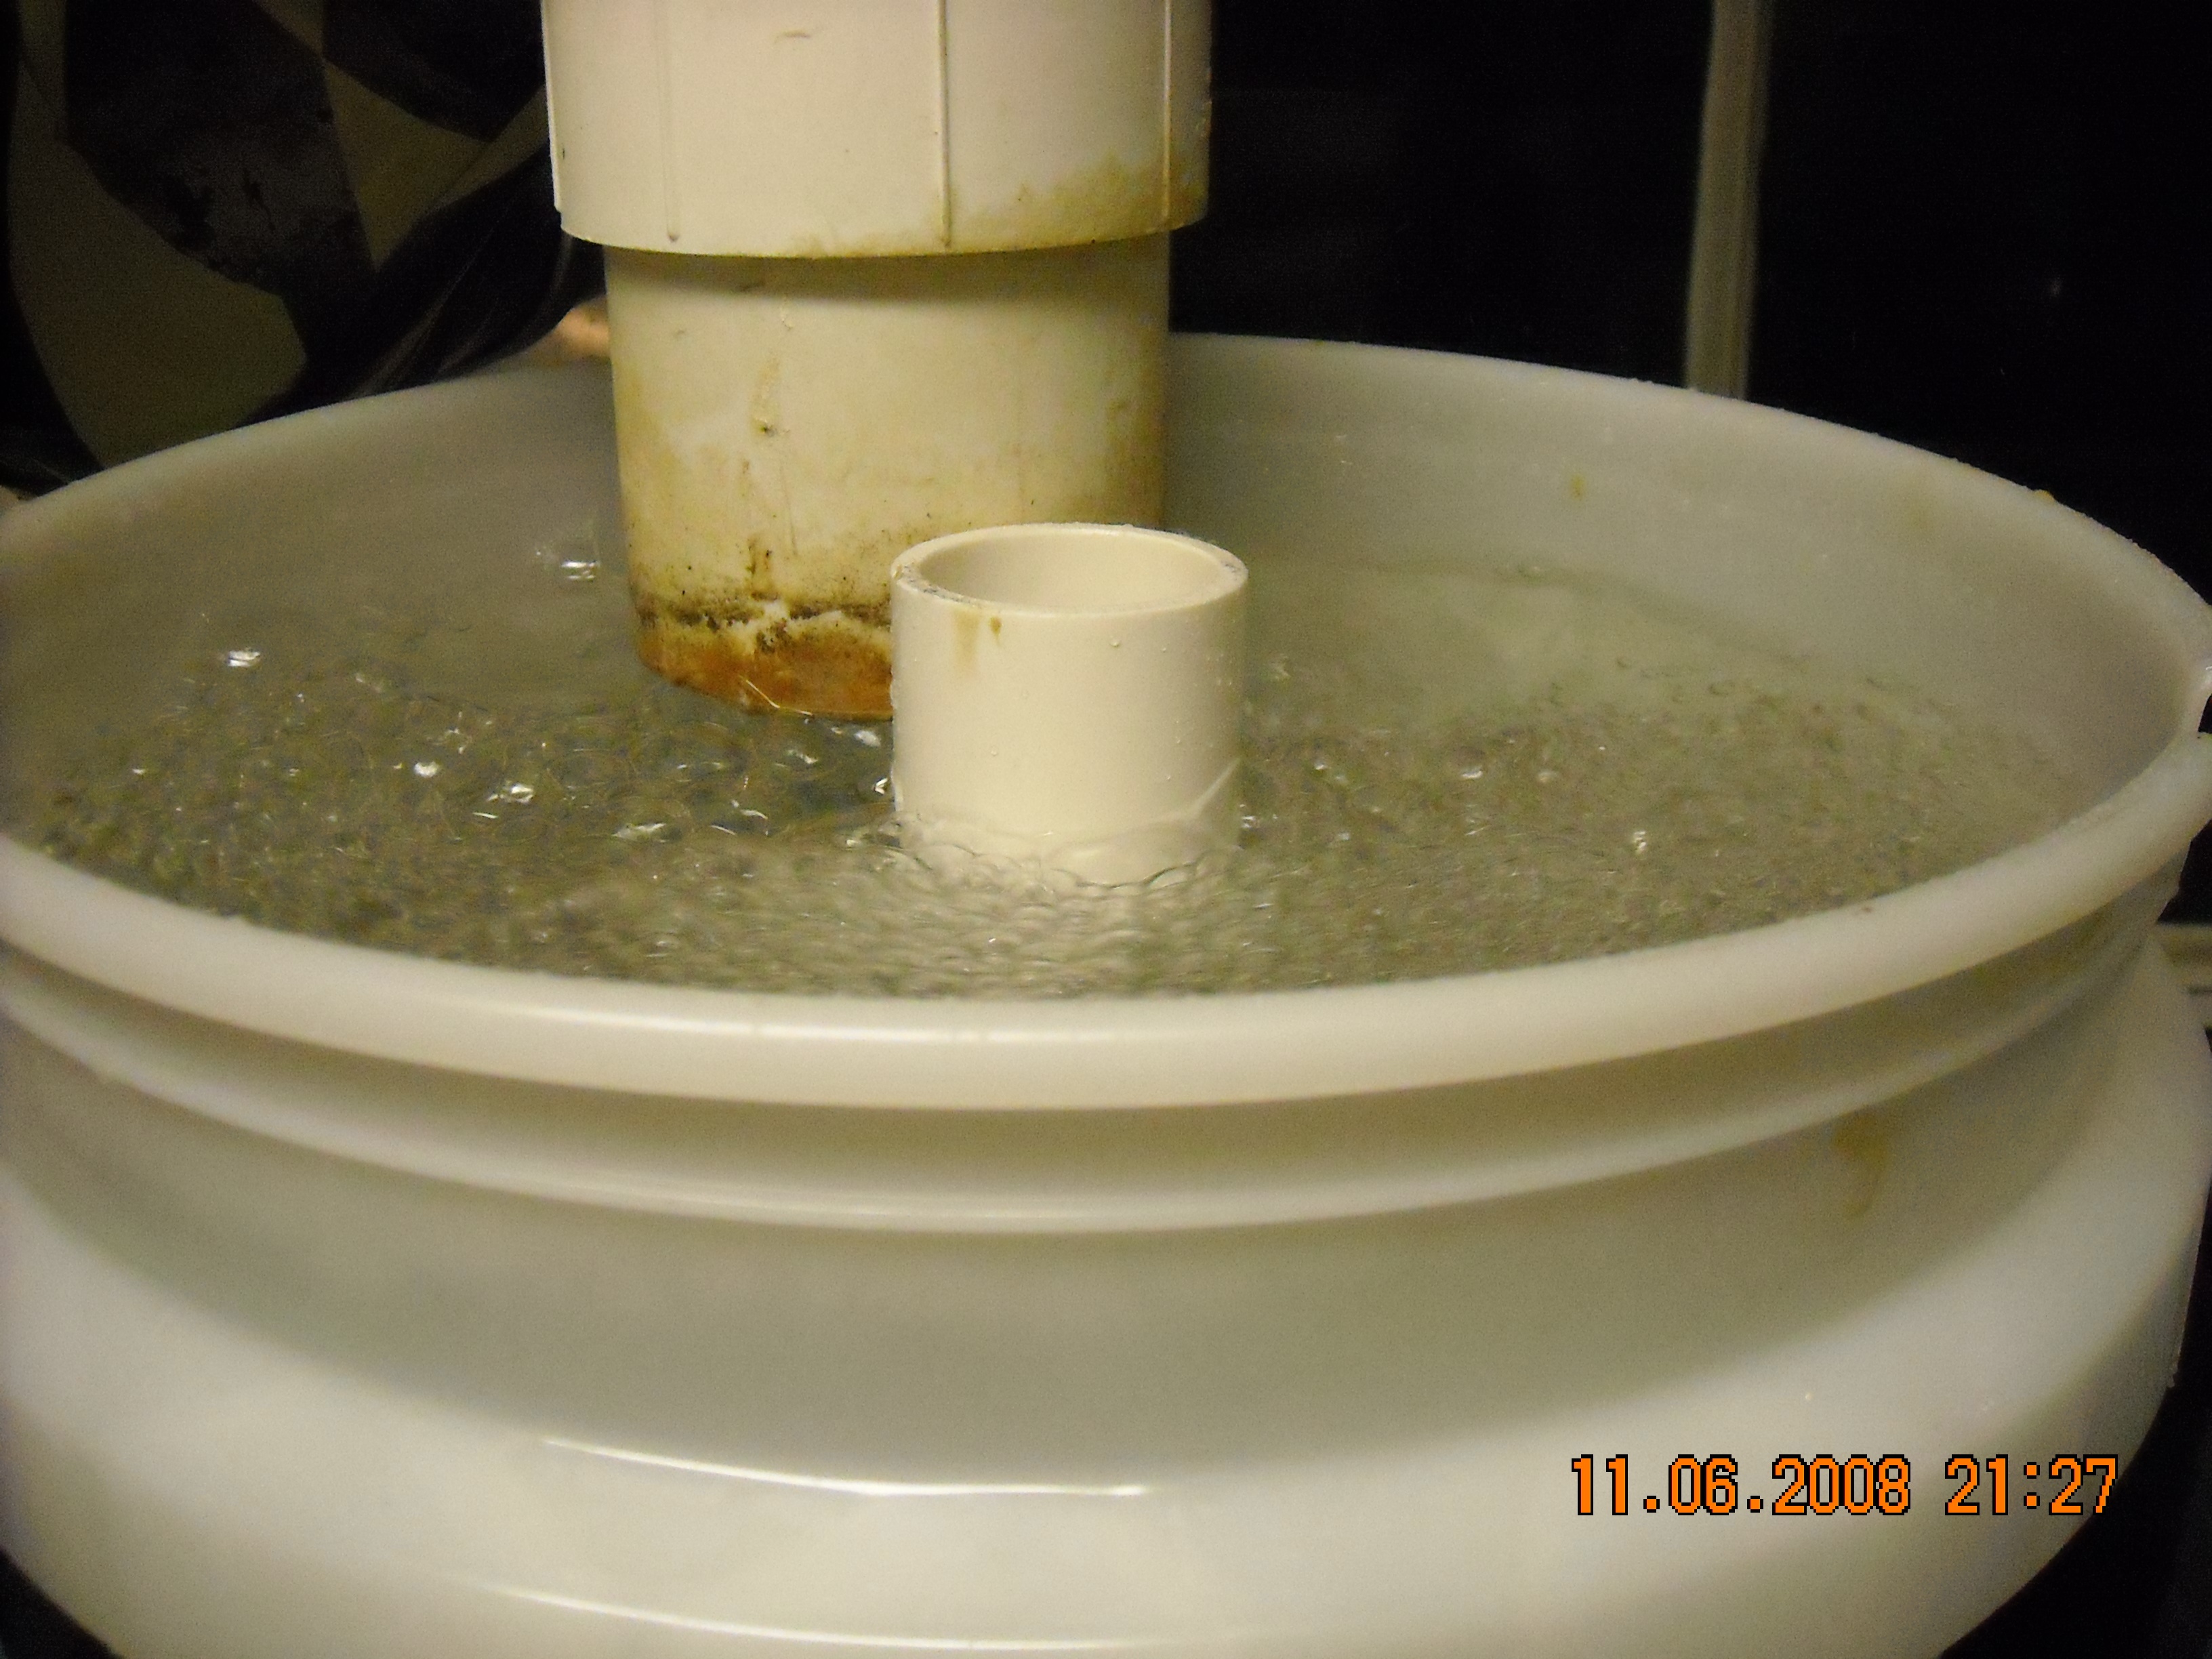
3) Record the height of the water in the bucket using a ruler (inches), be sure to place the end of the ruler on the edge to ensure contact with the actual bucket base. the pictures below show the techniques for recording water height.
4) For next reading change the flow rate manually and then wait approximately 5 minutes for the flow to acclimate.
5) Record the stabilized flow rate and the water height.
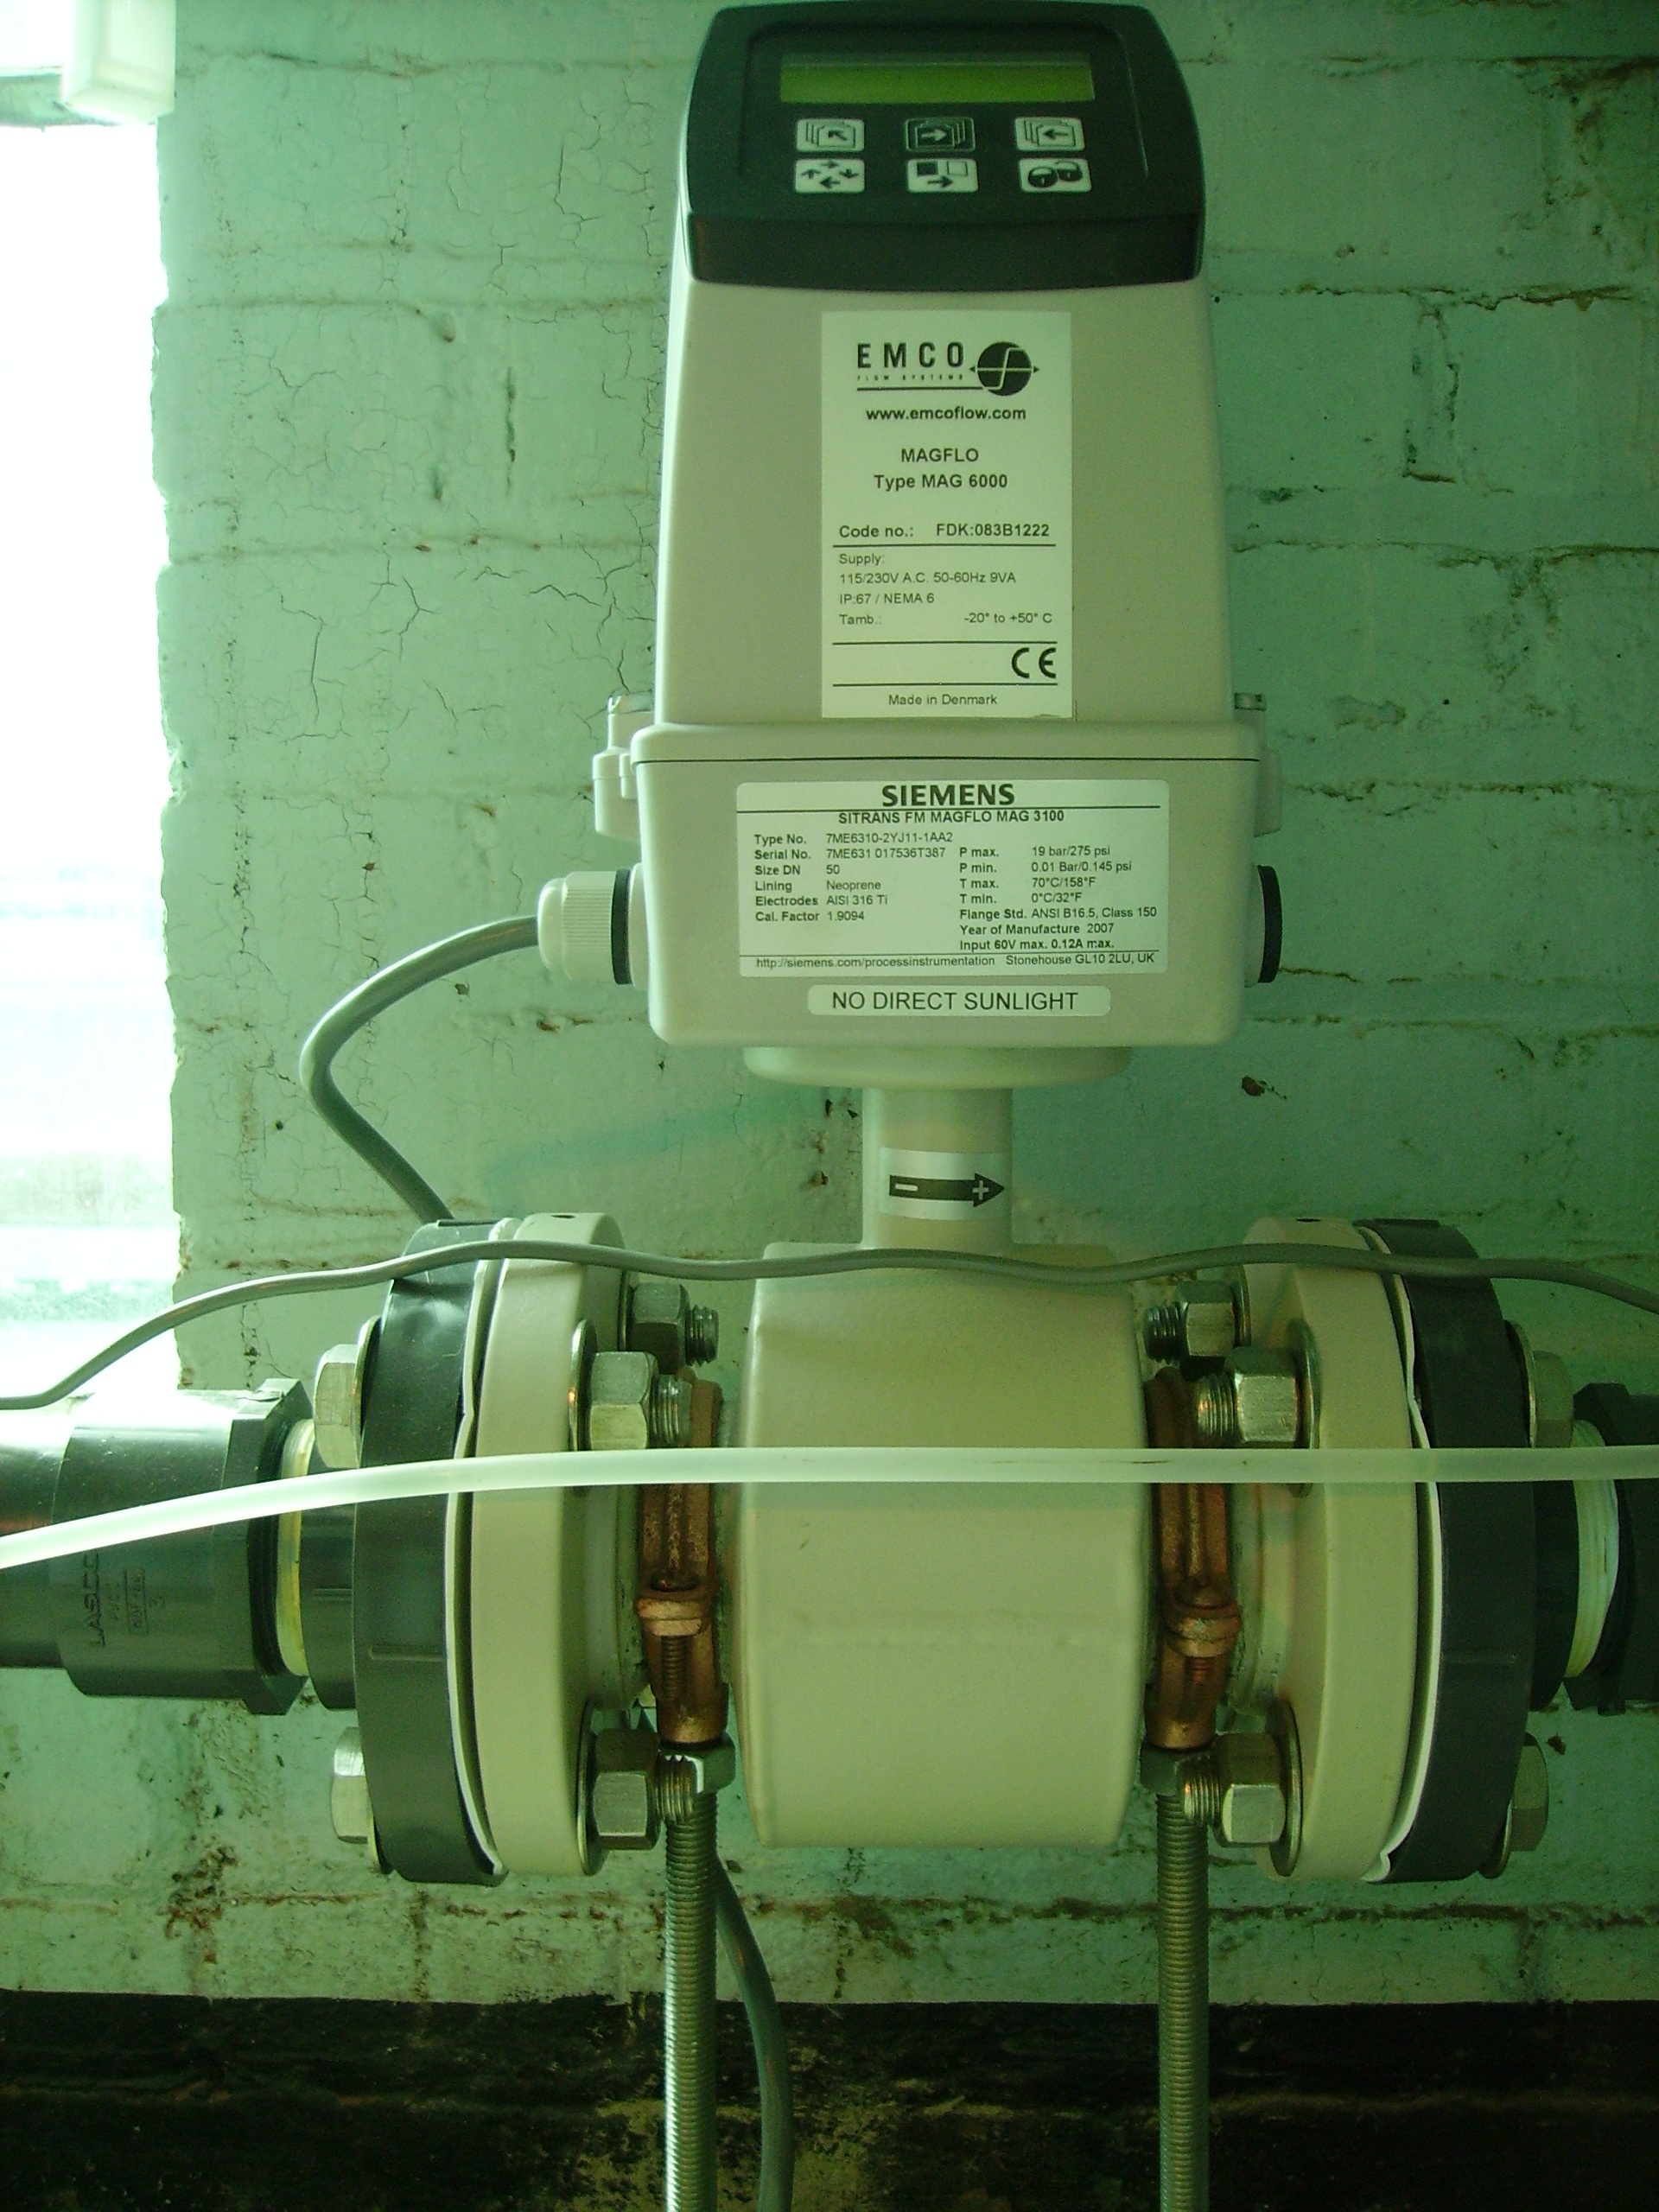
Figure 1: The sensor with display is pictured above and the model is SITRANS F M MAG 3100, statistics for the sensor are available at the Seimens website.
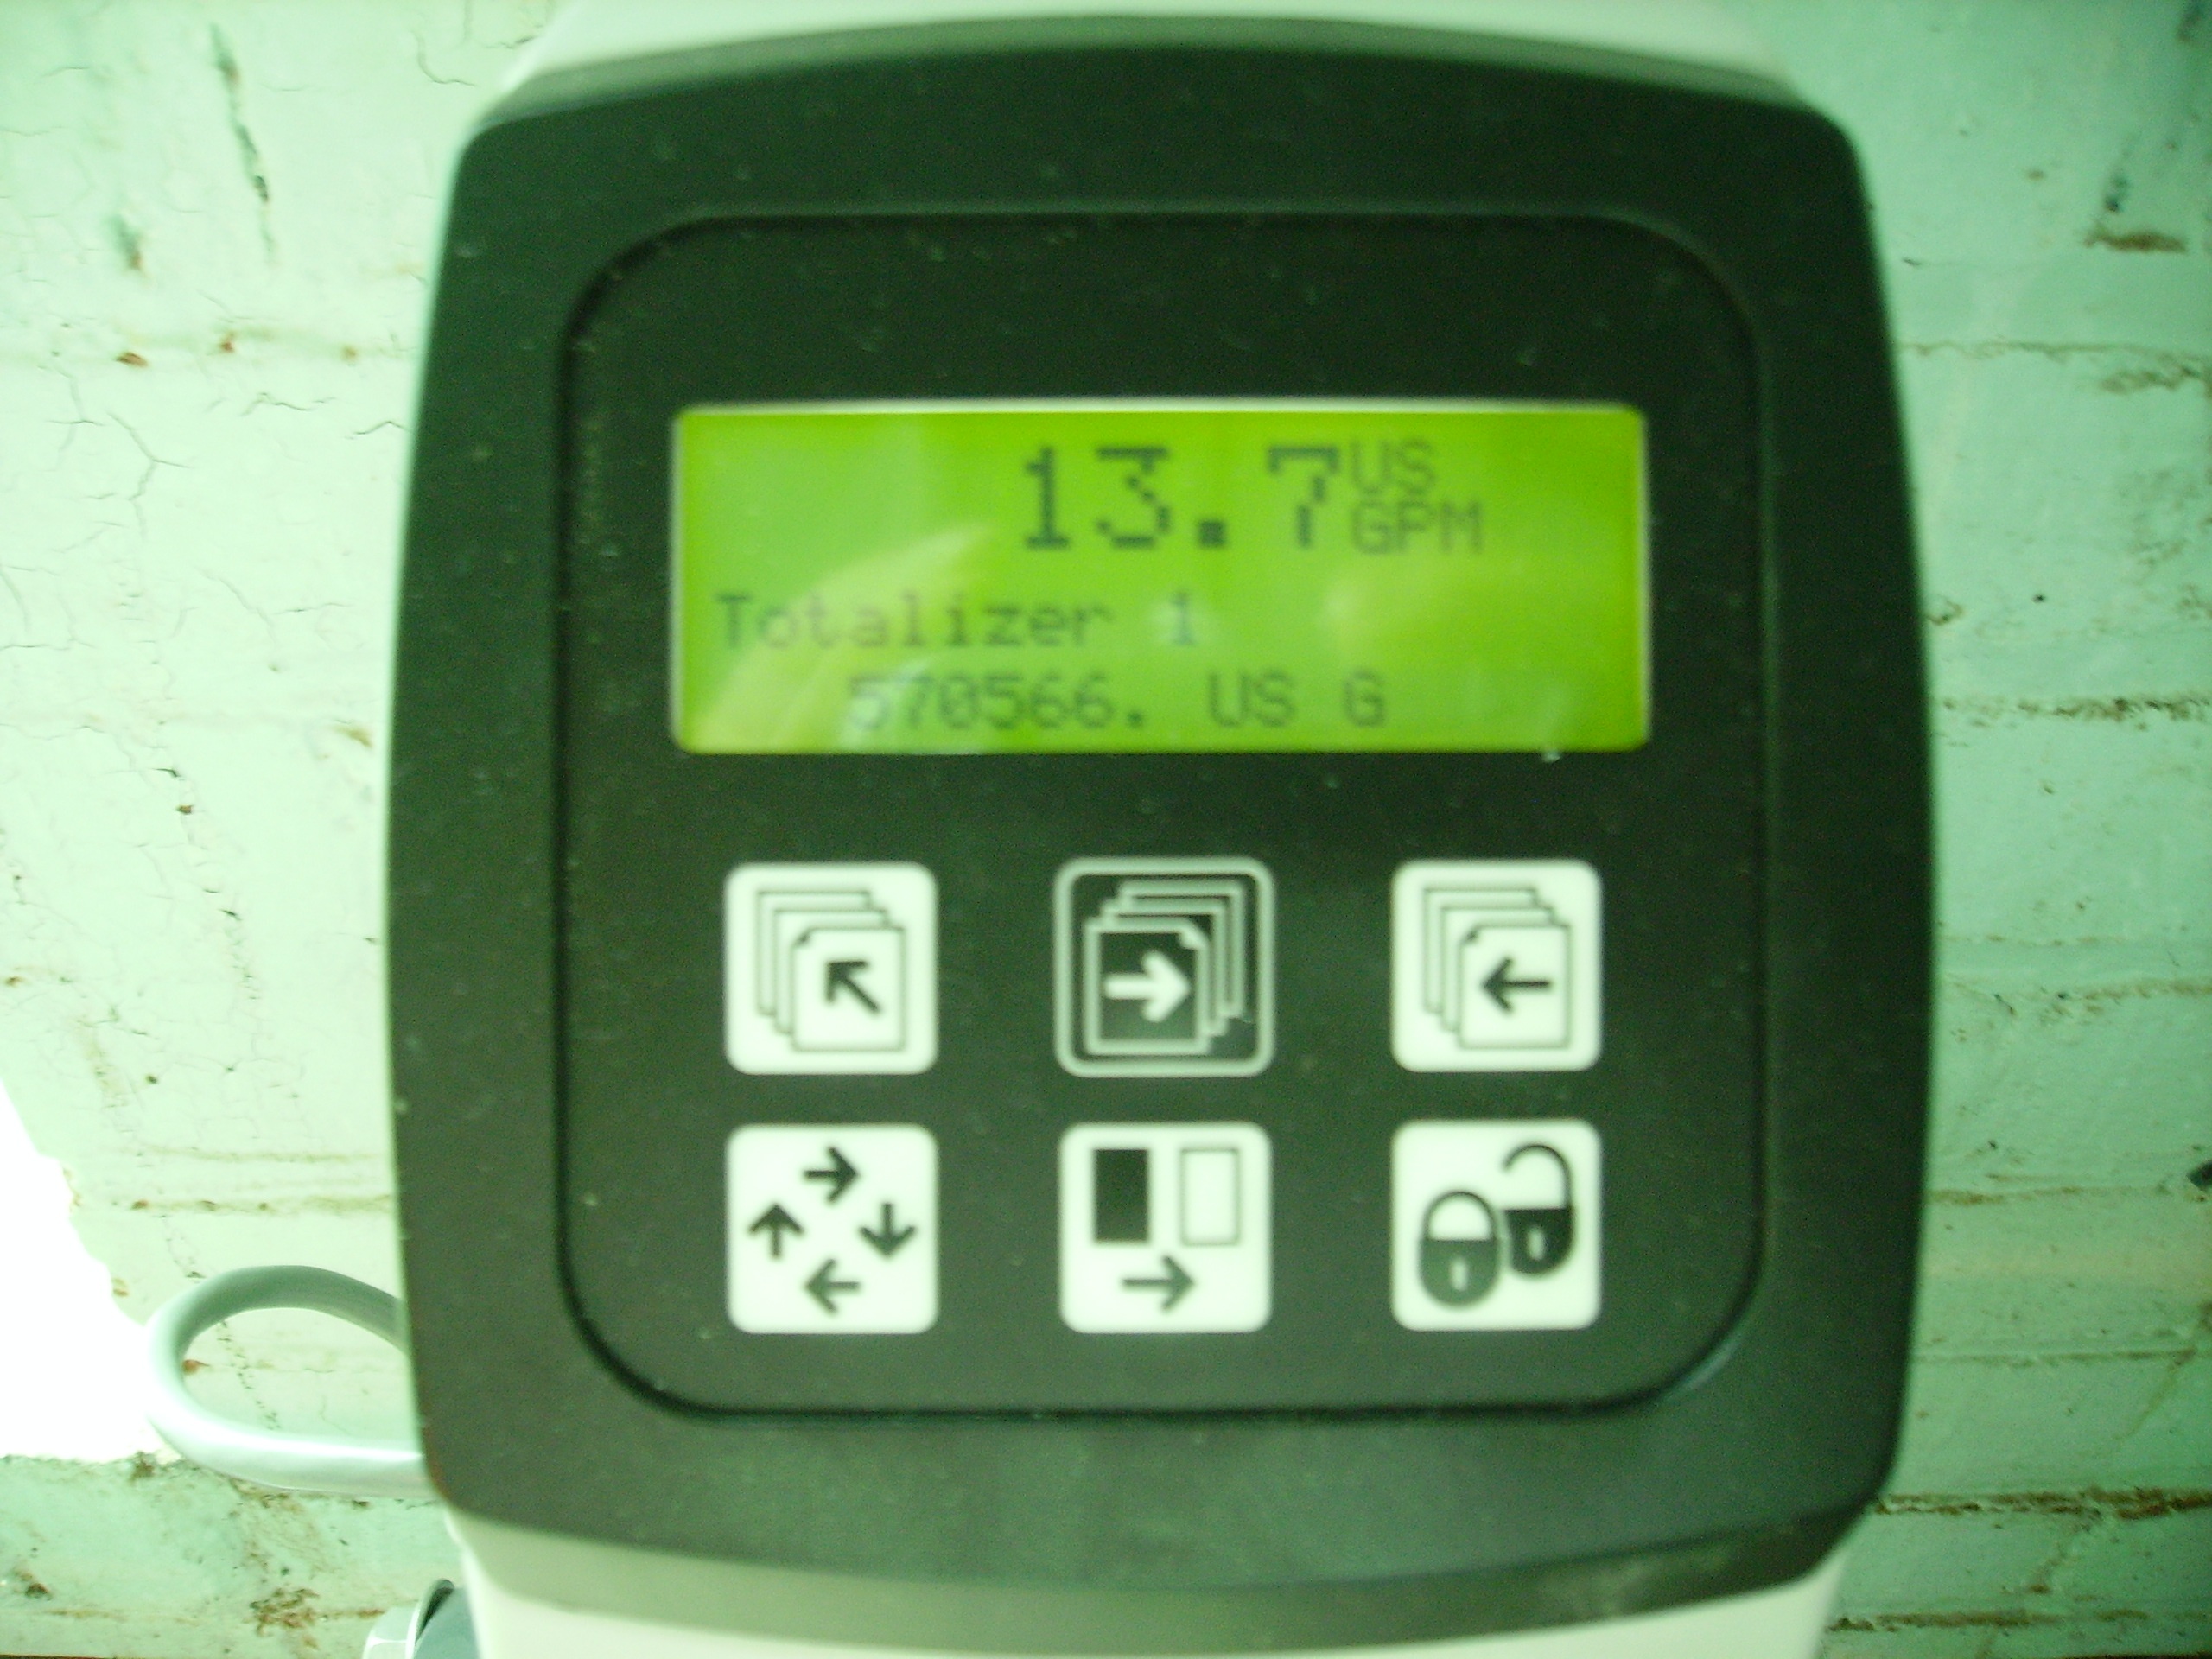
Figure 2: The microprocessor-based transmitter that displays the data is pictured above and the model is SITRANS F M MAG 6000, statistics are available at the siemens website.
The linear trendline of the data is y = -0.9653x + 38.22, with an R^2 value of 0.9556. This allows us to calculate the flow rate where the error between the predicted and measured flow rates differ by more then 10%. The flow rate of failure is 49.95 L/min which is less than the expected flow rate of failure, 62.5 L/min.
The results of the experiment were contrary to the expected results. Originally it was assumed that there was a certain maximum flow rate for a pipe, if the flow rate exceeded a maximum value the water entering the riser pipe wouldn't be able to leave quickly enough and the water would back-up in the pipe. THe results showed an alternative situation. The pipe was sized to reach the failure point at 62.5 L/min (half the maximum flow rate of the pilot plant - 125 L/min). The results showed a linear relationship between flow rate and height for all of the flow rates, the difference was that the slope fo the pipe had a different slope than the predicted values. Therefore the postulated constraints on the system do not entirely represent the actual situation. Momentum is not the only driving force.