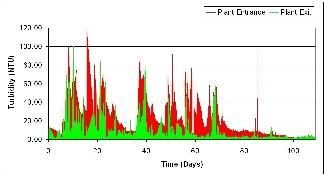
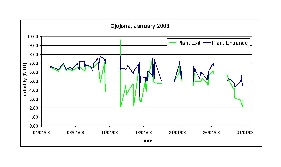
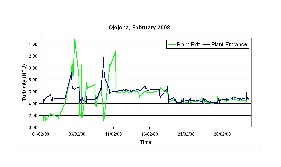
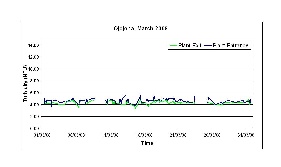
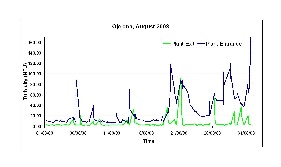
The graphs below are of turbidity data taken by the local plant operators. The operators work full-time at the plant and measure the turbdidity of the water entering and leaving the plant several times a day using an HF Scientific MicroTPW turbidimeter.
The Ojojona water board compiles the written data into an Excel spreadsheet and e-mails it to APP and Cornell.
Graph of Ojojona Plant Operating Data 8.24.2007 to 12.31.2007:
January
February
March
April
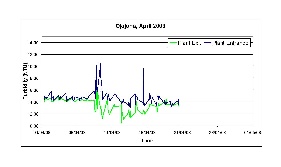
August
September
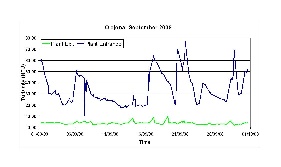
These spreadsheets include turbidity records found in the graphs above, as well as the plant flowrate, aluminum sulfate dose and chlorine dose.
OjojonaData2007.xls
OjojonaData2008.xls