Figure 1
March 14, 2008
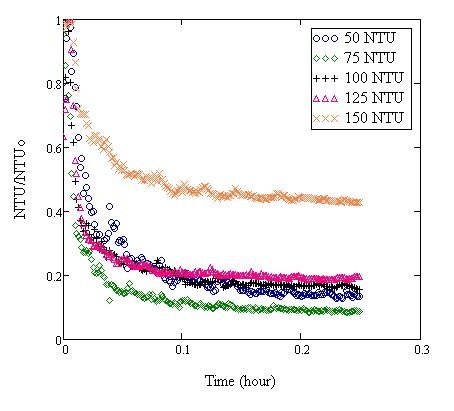
Presented here, another representative of data from Raw Data of Settling Column. Each data plot was normalized by the maximum incoming turbidity for each run. The figure 1 shows the effect of initial water turbidity to the sedimentation plot with 25mg/L alum.
Figure 1
Figure 2 shows the effect of different concentration of alum to the settling data.
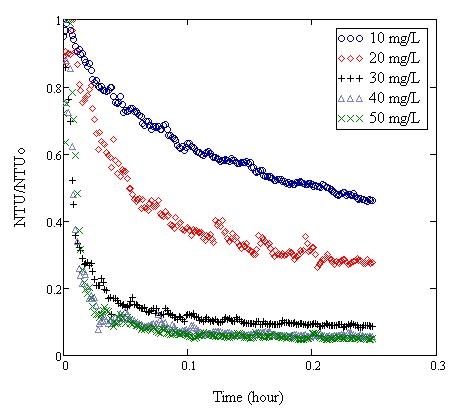
Figure 2
Figure 3 illustrates the turbidity data versus terminal velocity of Figure 2
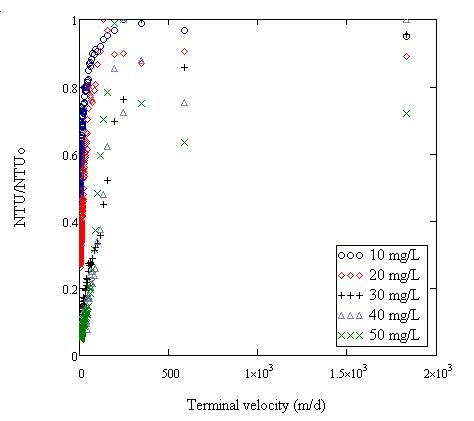
Figure 3
Figure 4 shows "the amount of settling" over time of Figure 2
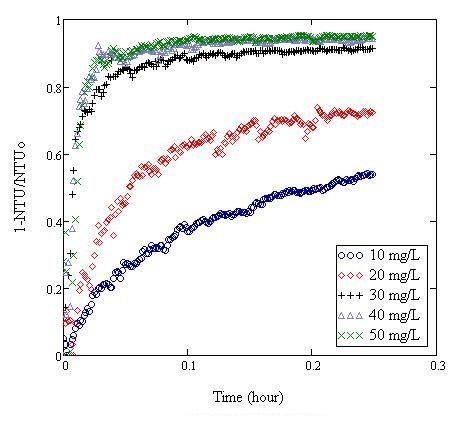
Figure 4
Figure 5 shows the Lineweaver-Burke plot of Figure 4
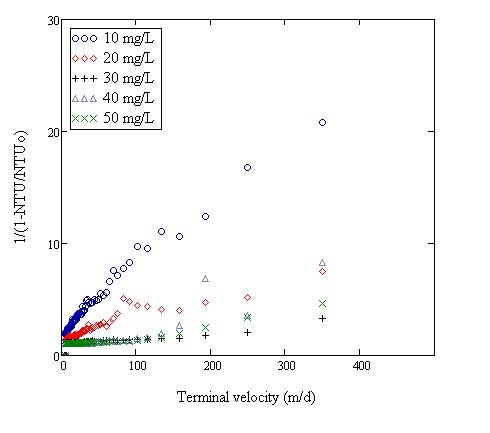
Figure 5