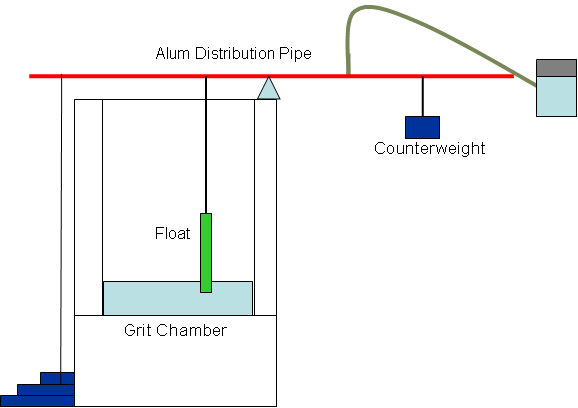
System with Floats and Weights
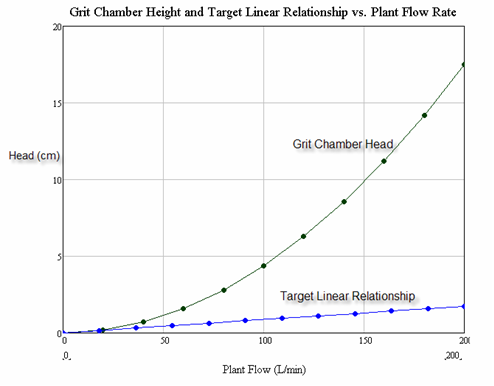
In this figure, the blue line represents the theoretical path of the float, following closely with the target linear relationship.
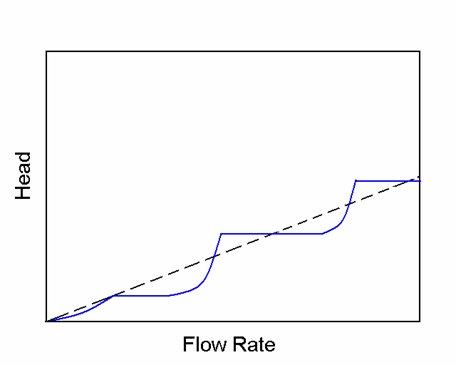
Figure 4: In this figure, the blue line represents the theoretical path of the float, following closely with the target linear relationship.
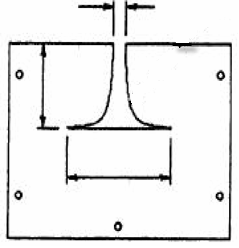
Linear Weir
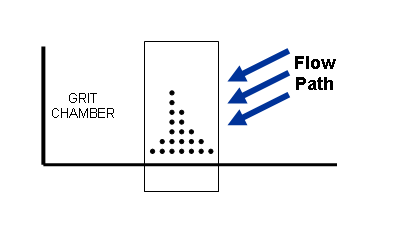
A Pattern of Holes which mimics the effects of Sutro Weir
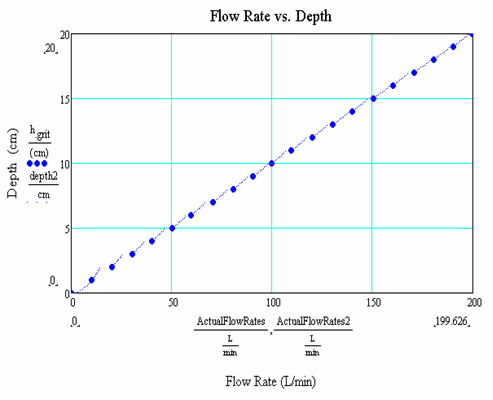
The Theoretical relationship between head loss in the grit chamber and plant flow rate
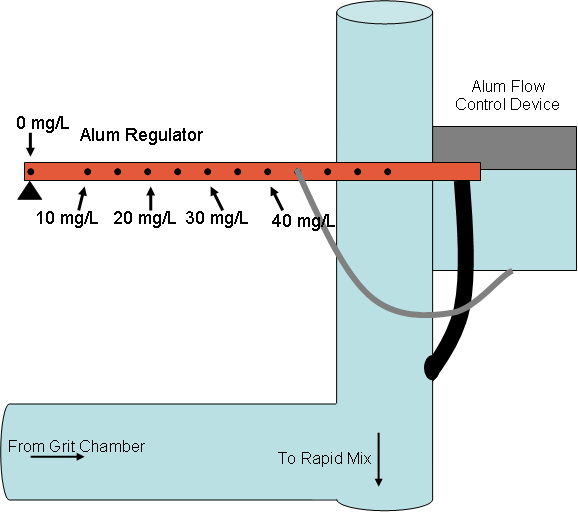
Figure 8: Alum Regulation to fit with the Present System at Ojojona