Accessible document of this page
Giving Day - selection of mobile devices.docx
Given the variety of mobile devices—vendors, versions and browsers—it is helpful to determine combinations more likely to be used by our Giving Day audience.
Selections have been made based on general usage stats, and stats specific to the most recent Giving Day.
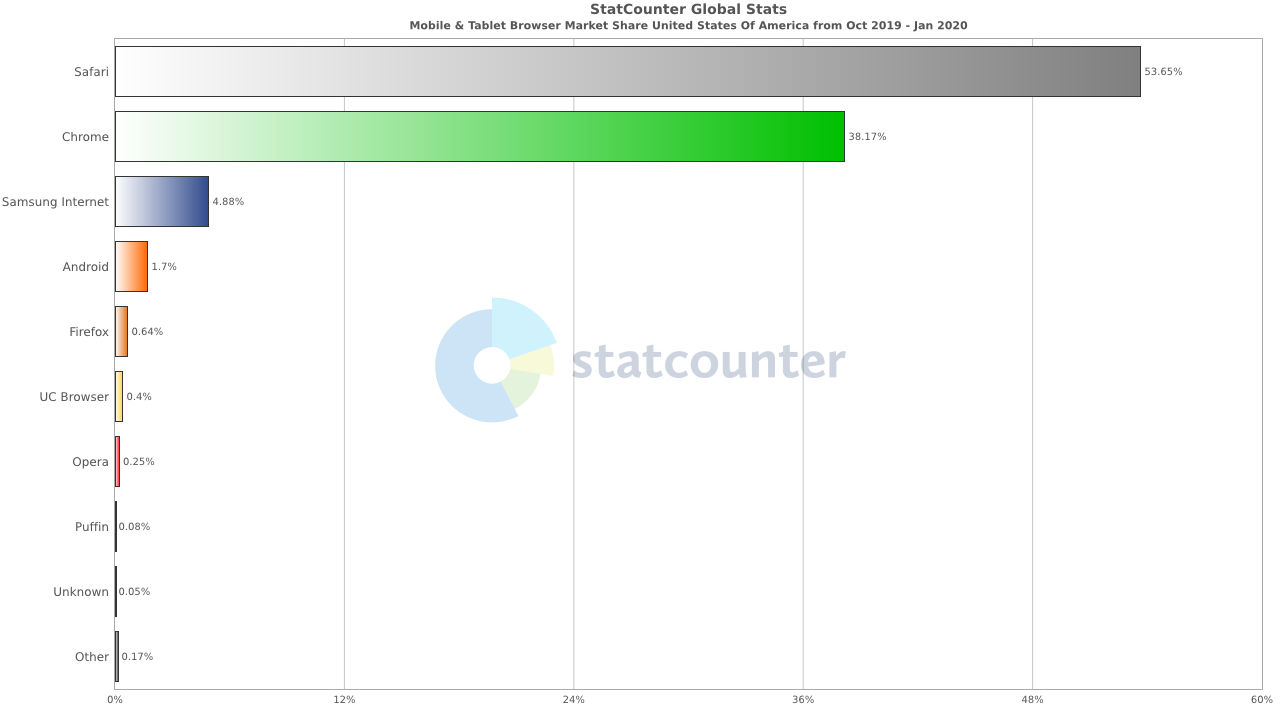
Chart summary: Mobile and tablet browser share USA from October 2019 – January 2020. Source: statcounter
Table 1 Mobile and tablet browser share Oct. 2019 - Jan. 2020
Mobile browser | Usage (%) |
Safari | 53.65 |
Chrome | 38.17 |
Samsung Internet | 4.88 |
Other | 3.30 |
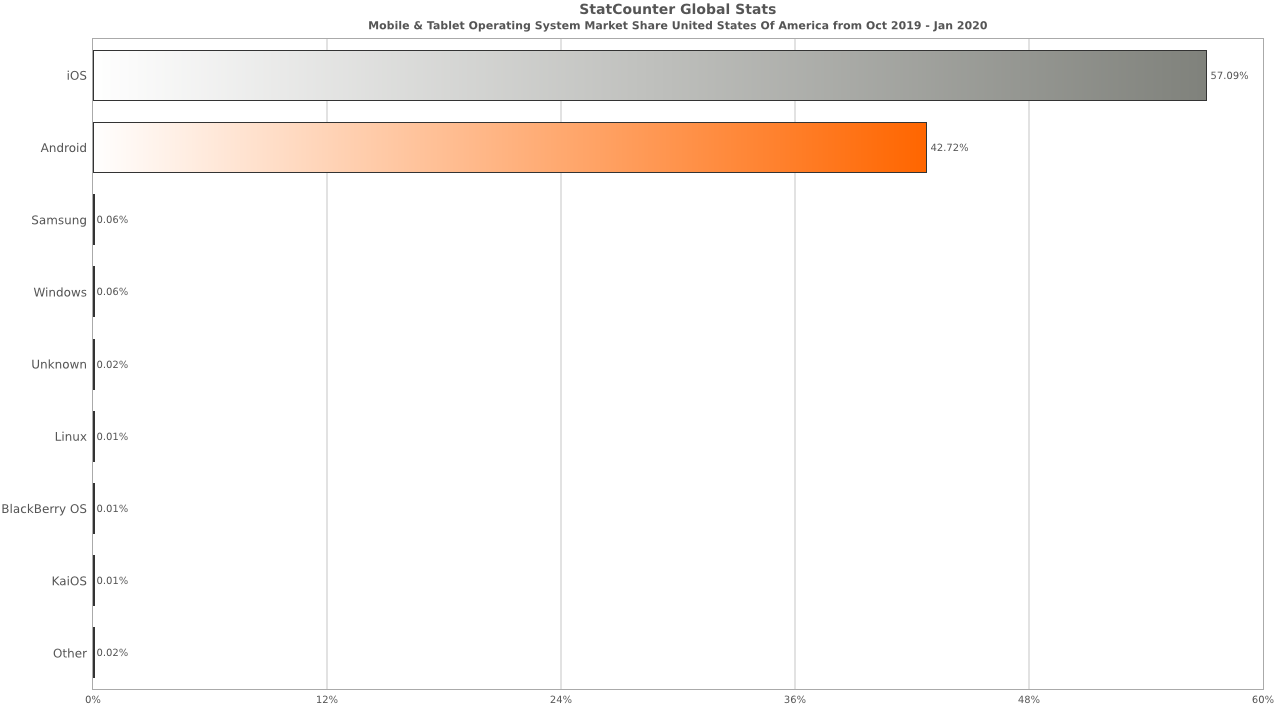
Chart summary: Mobile and tablet operating system market share USA from October 2019 – January 2020. Source: statcounter
Table 2 Mobile and tablet system market share USA Oct. 2019 - Jan. 2020
Mobile system | Usage (%) |
iOS | 57.09 |
Android | 42.72 |
Other | 0.19 |
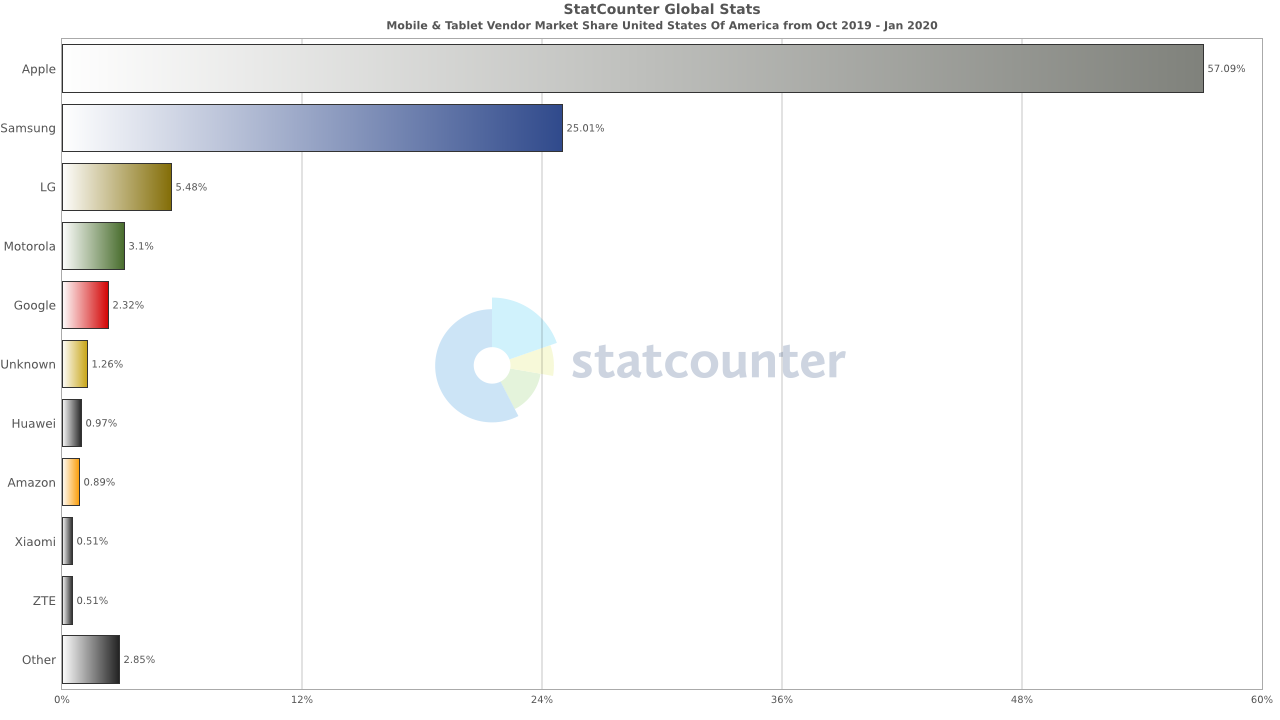
Chart summary: Mobile and tablet vendor market share USA from October 2019 – January 2020. Source: statcounter
Table 3 – Top three mobile and tablet vendor market share USA Oct. 2019 - Jan. 2020
Mobile vendor | Usage (%) |
Safari | 57.09 |
Chrome | 25.01 |
LG | 5.48 |
Other | 12.42 |
Table 4 – Top four mobile device usage during Giving Day 2019 - device type, percentage of mobile users, and percentage of mobile revenue. Source: Google Analytics data
Mobile device | Mobile device users (%) | Mobile device revenue (%) |
iPhone | 75.36 | 60.99 |
iPad | 6.61 | 21.06 |
Surface | 0.81 | 9.35 |
Samsung | 7.77 | 5.13 |
Other | 9.45 | 3.47 |
Additional factors