When setting up this simulation, we chose to use the k-epsilon turbulence model. We mentioned that changing these values should not have a large impact on the results of the simulation. As an exercise, try varying the values of k and epsilon and compare them with the original results. When specifying the inlet conditions, change the method to "Turbulent Intensity-Turbulent Length Scale". Set the intensity to 0.5%, and the length scale to 0.000588m.
One can look at the temperature profiles before and after the heated section.
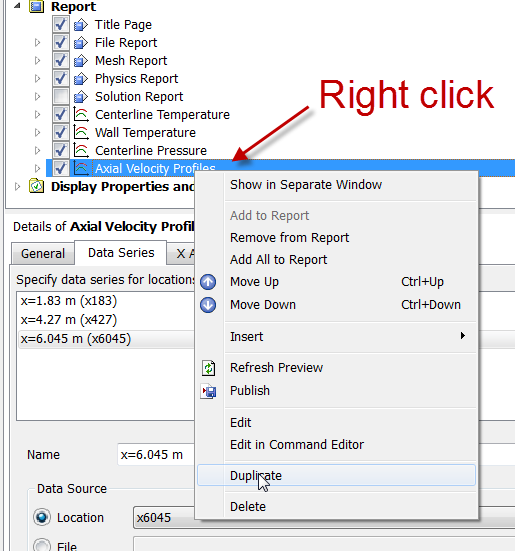
Duplicate the Axial Velocity Profiles chart by right-clicking on the plot name in the "tree" on the upper left. Rename it as "Temperature Profiles".
Double-click on "Temperature Profiles" in the tree view to edit its properties. This should be just below "Axial Velocity Profiles" in the list.
Change the title and x-axis variable (to Temperature). Click Apply. Here's what we get.
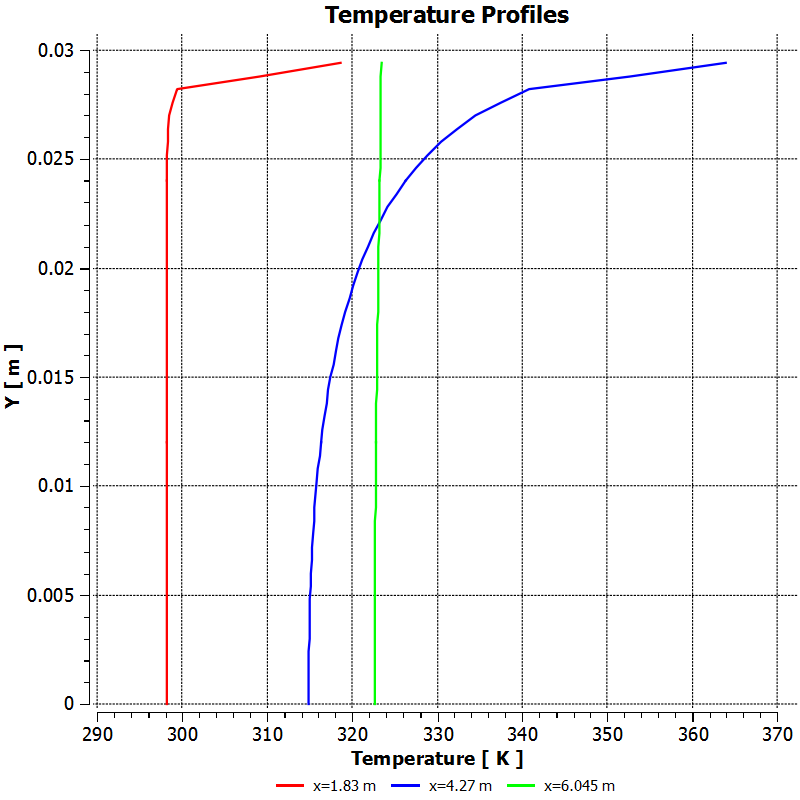
This plot shows that:
Go to all FLUENT Learning Modules