Location: Project Lab in basement
Skills: fluids, fabrication
Number of students: 4-5
Tasks and goals
Remove pressure sensors from the filter column to keep them dry while performing initial testing.
The head loss through the filter is higher than expected especially in backwash. We suspect that the head loss through the slots is higher than predicted. It is also possible that there is excessive head loss in the manifold past the slotted pipes that pass right through the manifold. Measure the head loss through a slotted pipe manifold system as a function of flow rate and compare with theoretical expectations. Submerge a single slotted pipe manifold in a tank of water. Connect the slotted pipe to a second tank that serves as a supply. Connect pressure sensors to each tank to measure the water levels in the tanks. The two sensors provide enough information to track both the difference in elevation between the two tanks and thus the head loss AND the rate of change of depth in the tanks which can be used to measure the flow rate. Design the pipe and valve connecting the two tanks to be large enough so that head loss through that pipe and valve is small. Measure that head loss by running the system without the slotted pipe attached. Then subtract the piping head loss from the total measured head loss to get the head loss through the slotted pipe. Compare the measured results with the orifice equation prediction for the slotted pipes.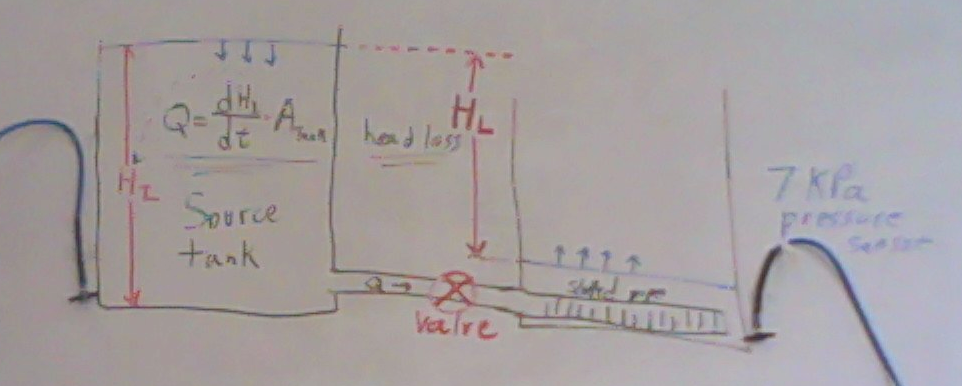
Determine what must be changed to reduce the head loss during backwash and replace/upgrade that component.
Add an extension on both inlet and outlet tanks using the hose clamp, stainless steel strap, and gasket material. The outlet tank must be higher than the top of the filter so that the filter can be filled with water so that the backwash siphon will work properly.
Ability to cycle between filtration and backwash
Evaluate flow distribution between sand layers using differential pressure sensors spaced 10 cm apart in the middle of each sand layer.
Measure the head loss required to fluidize the bed for clean and clogged bed conditions
Determine how much head is required to initiate backwash of a clean and of a clogged filter using the 2 layer at a time system.
Evaluate the option of adding flow restrictions on the inlet pipe stubs for the top and bottom inlets to achieve better flow distribution between layers.
Refine the design for required elevations of inlet and outlet tanks, pipe stubs, and backwash outlet.
Develop a method to fabricate inlet and outlet tanks including the weir system that is used to divide the flow between multiple LFSRSF.
Test the sand drain and see if any improvements are needed
Figure out a method that enables the operator to know if the sand is fluidized
Location: Right end of bench in B60
Skills: lab experience, fluids, Process Controller, Mathcad
Number of students: 2-3
Implement PID control in the clay dosing system (The SRSF Theory setup in the upstairs lab is a good example of this).
Upgrade the water supply so that it maintains the same temperature as the room temperature to reduce temperature gradients and density currents in the tube settler. Test this system and report the temperature fluctuations in the room and the water.
We may want to create a custom external code for process controller that takes a pressure sensor and two temperature sensors as inputs, a temperature set point, and controls a cold water valve. An almost identical piece of code would control a warm water valve.
Test the apparatus and make sure that flocs slide down the tube settler and are removed at the bottom of the tube by the water that flows past the bottom of the tube and on to waste. Operate the Settled Water Turbidity (SWaT) so the capture velocity is 0.12 mm/s
Repeat experiments with PACl dosages of 10, 20, 40, 80, 160 μM as Al and 50 NTU raw water. These tests are similar to conditions tested by Karen Swetland.
Compare the results obtained using the SWaT system with the previous results obtained using FReTA (Flocculation residual turbidity analyzer) and plot them on the same graph.
If SWaT performance is worse than FReTA then develop hypotheses to explain those differences and if possible test those hypotheses. The expectation is that SWaT should perform slightly better than FReTA if the temperature gradients between the water and the air in the room are kept small. Take video of the SWaT in action to see if there are circulation currents that indicate temperature gradients.
Once the experimental apparatus is proven to produce reliable and repeatable results, then we can begin to explore alternate flocculator designs that could enhance flocculator performance. We would like to explore intentional floc breakup and tapered flocculation. Both are based on the observation that our flocculation model predicts that colloids or small flocs can not attach to large flocs. Thus as flocculation proceeds there are fewer and fewer small flocs that can collide with each other to grow larger. We don’t know how small a floc has to be to have a successful collision with another small floc. We also don’t yet understand the mechanism for this behaviour.
The goal of the floc break up experiments is to create flocs that are small enough to combine with clay particles and small flocs but that are big enough to be captured by the tube settler. We don’t know if this floc size exists.
We have ordered 5 needle valves, Tee fittings, barbed fittings, and quick connect fittings to create 5 variable flow restrictions in the flocculator. The barbed fitting will connect to the straight run of a Tee. The other end of the Tee will connect to a needle valve and another Tee and another barbed fitting. The other port on each of the Tees will connect to a ¼” quick connect tube fitting that can connect to a pressure sensor. Thus there will be a pressure sensor across each valve to measure the pressure drop.
The 5 needle valve constrictions will create variable energy dissipation rates and hence different floc sizes. The pressure sensors installed across each valve will make it possible to adjust the head loss and thus the energy dissipation rate for each valve.
Experimental conditions
PACl dose of 4 mg/L as Aluminum
Raw water turbidity of 150 NTU
The spacing between the valves should be 1 m with the first valve 1 m from the rapid mix.
Total length of flocculator of 28 m (one section of the flocculator)
Flow rate of 5 mL/s
Run a control with the valves fully open
Every 15 minutes close each of the valves to get the next target head loss
Target head losses for the valves are 1, 2, 4, 8, 16, 32 cm.
Do not backwash the flocculator with these valves in place because they will cause too much head loss.
If floc breakup doesn’t reduce residual turbidity, then we need to develop an alternative explanation for the poor efficiency of residual turbidity reduction after initial flocculation. Tapered flocculation would be worth exploring to see if that gives us any more insights. If we use tapered flocculation we might consider using a wide range of energy dissipation rates. The first step would be to experiment with extending the coiled rapid mix tubing to see if that enhances performance.
Location: Left end of bench in B60
Skills: AguaClara processes, fluids, Process Controller
Number of students: 3
Read the notes on flocculation models and in particular slides 17-51. There is also good information on how to estimate clay surface coverage starting on slide 57.
Upgrade the water supply so that it maintains the same temperature as the room temperature to reduce temperature gradients and density currents in the tube settler. Test this system and report the temperature fluctuations in the room and the water.
Keep the entire flocculator under positive pressure to reduce kinks. This will require that you keep the raw water tank as high as practical.
Devise a method to measure the flow rate through the flocculator. I propose a reverse bucket and stopwatch system in which the water supply is turned off and you measure the rate of draining of the raw water tank. Create a state in Process Controller to collect this data. The resulting height (from the pressure sensor) vs time can be used to extract the initial flow rate. The relationship between Q and H is expected to be of the same form as the minor loss equation. Thus analyze the results and fit the minor loss coefficient (quadratic curve fitting). Once you have obtained the minor loss coefficient then you can use the minor loss equation to estimate the flow rate given the height of water in the entrance tank.
Measure the head loss through the flocculator either using a 7 kPa pressure sensor that is connected between the beginning and end of the flocculator
Calculate the average energy dissipation rate based on the equation 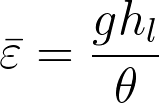
We may want to create a custom external code for process controller that takes a pressure sensor and two temperature sensors as inputs, a temperature set point, and controls a cold water valve. An almost identical piece of code would control a warm water valve. This would simplify setting up the control for the raw water system
Design and test the clay metering system. The high flow rate of this flocculator (100 mL/s) will require a high mass flux of clay. The maximum flux is set by the maximum target turbidity. We will likely want to test up to 500 NTU. We can convert between turbidity and clay concentration using the approximation that 1 mg/L of Kaolin clay = 1.7 NTU.
Determine the maximum clay stock concentration that can be pumped with a peristaltic pump. Test the stock concentration and the pump rate such that you obtain the target mass flux of kaolin clay. Use a minimum size of tubing to prevent clay from settling in the tubing. Measure the head loss in the tubing to ensure that it is less than about 2 m so the peristaltic pump won’t have problems pumping the clay slurry.
Use PI control and peristaltic pump to add clay into the raw water tank. Casey can provide guidance on the PI settings. Casey and Monroe are working to develop equations for the P and I terms so that we can have the PID system work well even as the clay stock and target turbidities change. If possible test the algorithm with your apparatus by varying the target turbidity and then measure the response. Determine how long it takes the the system to stabilize at a new target turbidity
Remove air from the effluent of the flocculator upstream from SWaT to prevent air from getting into SWaT. The air removal system can be identical to SWaT except have the tube be vertical and pump the air and water to waste. Consider using a 1 rpm peristaltic pump for this purpose. Use the largest tubing size (#18) to achieve a flow rate of 3.8 mL/min.
Check the calculations for the capture velocity in the tube settler.
Set the flow rate through the tube settler so the capture velocity is 0.12 mm/s.
Design an cculator for 12 hour tests without replacing the PACl stock. Use a target range of PACl dosages that match the range used by Karen Swetland.
Experiments!!!!
The goal is to test our hypotheses concerning flocculator performance as a function of turbidity, coagulant dose, residence time, and energy dissipation rate. The first experiments should test system performance, ensure that the system produces repeatable results, and ensure that we understand how long to operate the system to arrive at steady state operation. We expect steady state operation to occur sometime between one and two hydraulic residence times counting both the flocculator and the tube settler. Devise a time efficient method of cycling through different experimental conditions with the goal of obtaining reliable and repeatable settled water turbidities. There shouldn’t be any need to flush the system between tests. Thus the time for one experiment will likely be approximately 2 times the hydraulic residence time of the flocculator and SWaT system. It is likely that the entire matrix of 25 tests can be conducted in one day.
Karen Swetland used coagulant dosages from 10 to 150 μM as Al (see page 85 in her dissertation). A reasonable set of coagulant dosages would be 10, 20, 40, 80, 160 μM as Al. The turbidity range is 5, 15, 50, 150, 500 NTU. It should be possible to run the flocculator continuously and increment the coagulant dosages. Process Controller can also be set to increment two parameters and thus it may be desirable to have Process Controller vary both coagulant dose and turbidity to collect the entire array of experimental data. The challenge will be getting the turbidity control to work well over the factor of 100 range from 5 to 500 NTU. That range will require adjusting the stock concentration because the pump can only vary from about 2 rpm to 100 rpm - a factor of 50.
The 3rd parameter to vary is the capture velocity of the tube settler. This can be varied by changing the flow rate of the peristaltic pump that pulls the water through the effluent turbidimeter and the tube settler. A reasonable range of capture velocities to test would be 0.06, 0.12, 0.25, 0.5, 1.0 mm/s.
The tentative model for turbulent flocculation that we have derived is shown below. W is the Lambert W function. t is residence time in the flocculator, the colloid size is approximately 2 μm, Γ is the coagulant coverage of the clay, and phi is the original volume occupied by the clay and coagulant precipitate. This model does not yet incorporate the 2 phases of flocculation and thus this model over predicts performance when the term in the parenthesis is less than about 1.

Foam Filtration (EPA P3 Phase I award effective August 2014)
Location: B63
Skills: fabrication, experimentation, design
Number of students: 3
Foam filtration has the potential to be a very low cost, flexible, and high performance water treatment system. Foam of different pore sizes can be stacked or used in filters in series to achieve high removal efficiencies starting from high turbidity raw waters.
Agua Para el Pueblo is eager to test the foam filter in a town in Honduras. Before doing that we need to assess the risks of chemical leaching from the reticulated foams. Reticulated foams are used for drinking water treatment (see technical foam services). Contact manufacturers that provide reticulated foam for drinking water to get their specifications on leached chemicals. Professor Damian Helbling may also be able to test for leached chemicals from reticulated in 2015.
The goal is to ship a working foam filter to Honduras this summer. We will need to stay in contact with Antonio Elvir and Drew Hart to see how their testing of the foam filter evolves and see if it is best to ship an entire foam filtration unit or if they want to fabricate a new compression system just based off of a design that we create (and test) in our labs.
Evaluate and Simplify the compression system
Measure the maximum compression velocity attainable with the pulley system with the foam. Compare with the target of approximately 0.2 m/s that was obtained by the Foam Filtration team in the Spring of 2014 (see page 23). If this compression velocity can not be reached using the current pulley system evaluate options for increasing the compression velocity including reducing the mechanical advantage, using two people to compress the foam, or switching to a hydraulic compression system (see below).
The compression system can be simplified before shipping to Honduras. Paul Charles has great ideas for an improved compression frame. It may also be possible to have the fabricator that builds the dose controllers fabricate a lightweight frame. There are two big options for the frame. The frame could be a simplified 80/20 system or a lightweight design could be fabricated in a shop with aluminum welding capabilities. This is more likely how the frame would be fabricated in Honduras (or India).
If the frame is fabricated in a shop it should have the following characteristics.
The frame should disconnect from the drum without requiring any tools. Clamps or latches could be used to connect to the drum.
The sleeve that the compression piston slides through could be a square aluminum tube.
The height of the sleeve could be as short as possible while still providing good stability to the piston. The sleeve should also extend as far down into the drum as possible rather than extending high above the drum to reduce the overall length of the piston.
The frame of triangles that connects the sleeve to the drum should be welded together so that the interior of the sleeve is not affected by fasteners.
Reduce the head loss or increase the capacity to handle head loss
Flow through the foam filter in Tamara, Honduras was limited by head loss that caused the drum to overflow. Measure head loss accumulation and effluent turbidity as a function of PACl dose for 500 NTU raw water. Determine how much head loss the foam system produces at the onset of the increase in effluent turbidity. If this head loss is larger than can be accommodated with the 55 gallon dr um, then explore options to extend the possible runtime of the filter.
Use larger reticulated foam at the top of the filter to reduce the head loss. Larger pore reticulated foam is available up to 10 pores per inch.
Use a deeper filter body. Explore the option of using HDPE pipe.
Lower the effluent pipe as the head loss through the filter increases. Explore options for automating the lowering of the effluent pipe.
Chemical dosing and Flow Measurement
Add an LFOM and half size 2 lever dose controller to the foam filter. The LFOM will make it possible for the operator to quickly measure the flow rate. The LFOM will need to be designed to be integrated with the float for the dose controller. It is possible that the LFOM will be reversed from the normal entrance tank in an AguaClara plant. The raw water and the float could be inside a 15 cm diameter LFOM and the water would flow out of the holes and fall into the filter body. Some sort of a drop tube may be necessary to prevent splashing.
The LFOM should be designed to have 10 cm of head loss to drive the half size dose controller system. Design the compression frame and dosing/flow measurement system to be integrated.
Performance testing
Once the entire system is fabricate it will need to be tested through cycles of filtration and cleaning to characterize performance and explore design options. It will be easy to compare different combinations of reticulated foam pore sizes.
Evaluate hydraulic compression option
This option is only possible if we switch to a filter body made from pipes. HDPE would be an great material to use and spin welding could be used for connections. Perhaps the clamping system developed by the LRSRSF team could be used to attach a bottom to the filter. Note that during compression the connection between the bottom of the filter and the filter body has to withstand 500 lbs of tension.
Program Efficiency Analysis
The following are ideas for all of us to be thinking about as we move AguaClara forward. These rambling thoughts aren’t assigned to anyone as of yet. If there is something here that you would like to help us improve, please go for it!
As we explore expanding the number of implementation partners and increasing the rate of building facilities it is time to evaluate our processes for handling information and materials from the design phase all the way to the plant inauguration. There are undoubtedly many ways that we could improve our efficiency and thus lower our costs of production.
RIDE system
Are we setting the best priorities for research and invention? What other topics should we be investigating to improve the overall program performance?
Design Team
Create the section cuts needed.
Implementation Partner
Design
Construction
APP needs to select someone to be trained to build the plastic components so that AguaClara Engineers aren’t needed for this purpose.
Are there alternative construction methods that we should consider tank walls, weirs,
Facility coordinates from AutoCAD to the Construction site
How could the design data be taken all the way to construction site in as convenient a format as possible? There is undoubted a place for printed drawings to provide guidance for the construction team. Could the critical elevation data and xy location data for plant components be connected to a total station? What would be the best way to ensure that elevations are correct in a facility?
Determine what surveying equipment would speed up and the construction and also reduce errors.
Fabrication of plastic components
How could the cost of the plate settlers, flocculator baffles, sed tank inlet manifolds, and SRSF manifolds be reduced? Currently, these items are fabricated onsite by potential future plant operators. Given the turnover in plant operators is this the most efficient way to fabricate these items or should these items be fabricated in a workshop equipped for these tasks?
Ideally the plastic components could be fabricated at the same time as the civil work is underway to reduce construction time.
Should we explore other options for building plate settlers or tube settlers (pending what we learn about reducing temperature gradient effects)?