Figure 1.
February 27, 2008
Another set of data has been evaluated. The alum dose for this particular experiment was 40mg/L and the clay dose turbidity was set at 125NTU.
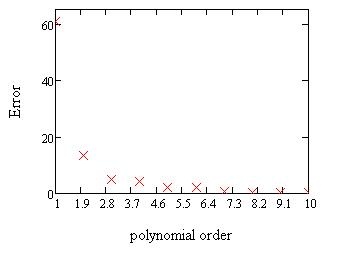
The sum squared error has been evaluated for the n th degree of polynomial regression.
Figure 1.
Polynomial regression was evaluated on the raw data. The logarithmic regression was done for comparison purposes. However the equation for logarithmic regression was nonlinear.
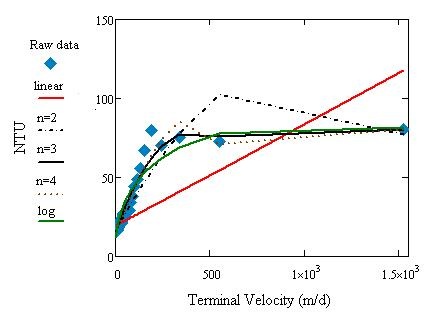
Figure 2.
March 7, 2008
Another example of how the data was analyzed (from previous experimental setup).
Alum = 35mg/L, initial NTU = 75 NTU, Flow rate = 1.443 mL/s
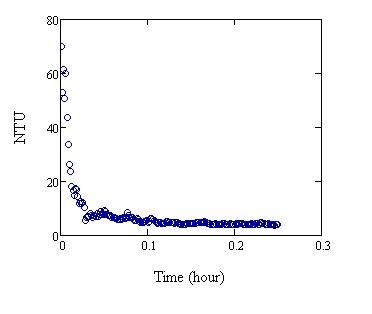
Figure 1. Raw Data
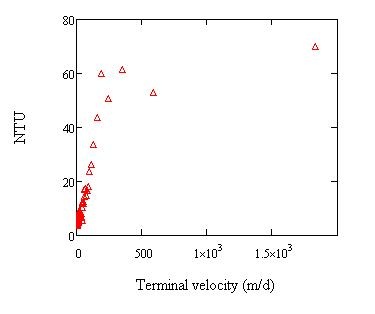
Figure 2. Turbidity vs. Terminal Velocity
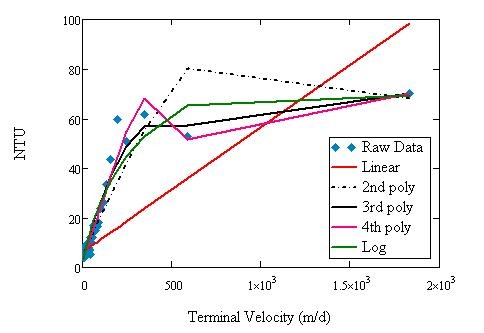
Figure 3. Regression plots. Regression was done for up to the 10th degree of polynomial.
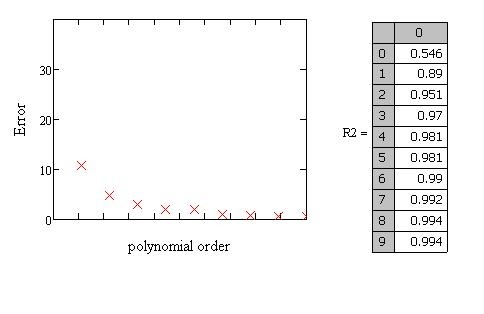
Figure 4. Sum squared error and R2 value