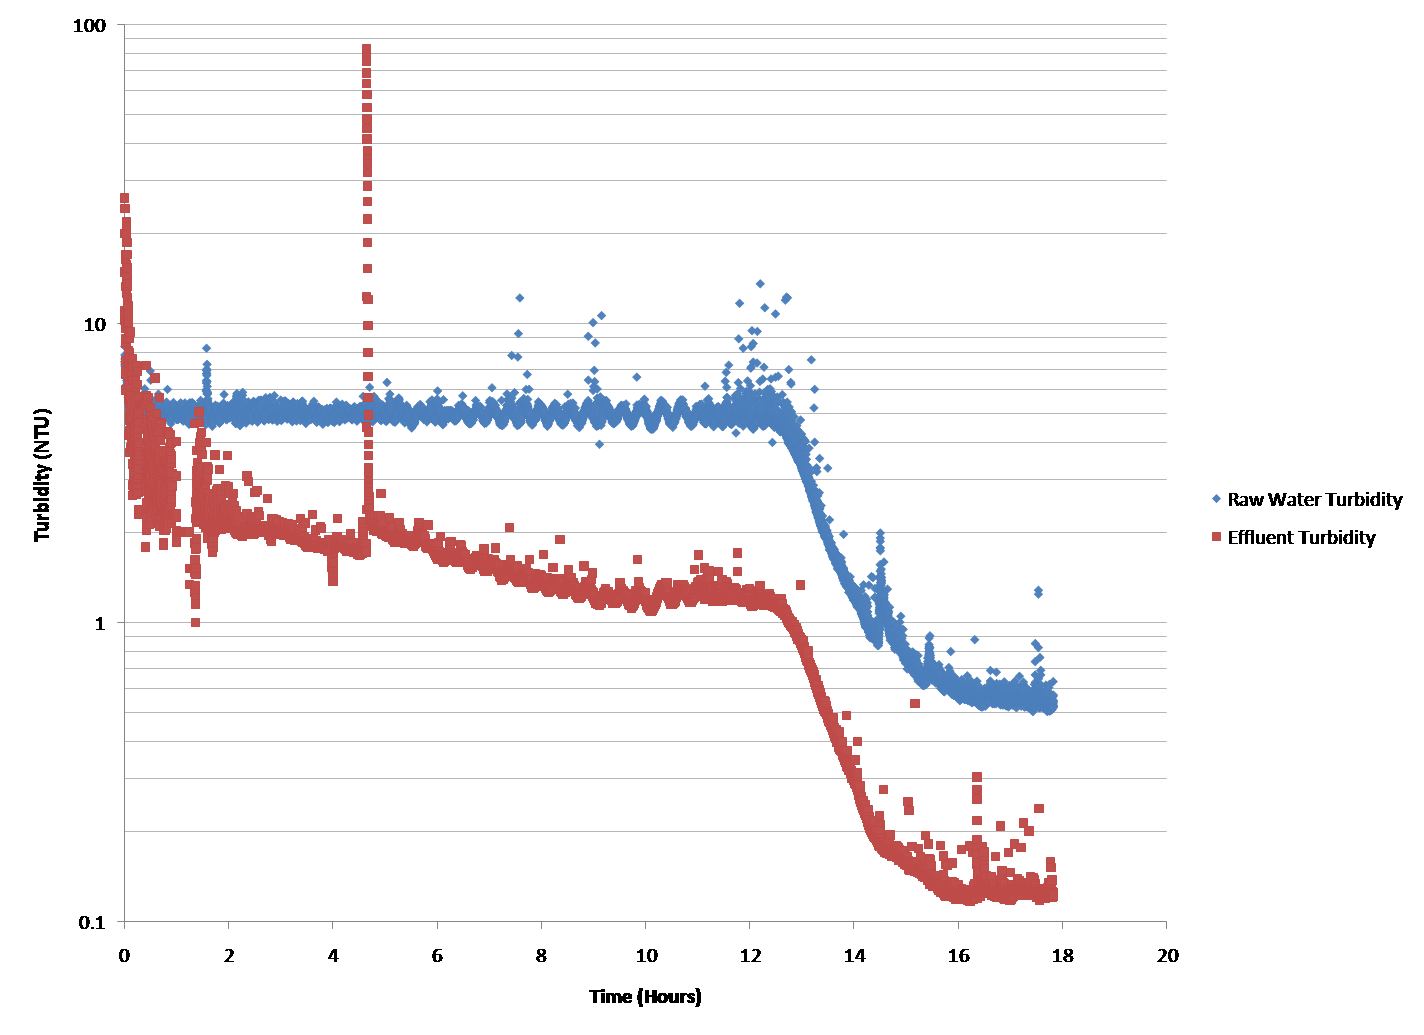
Figure 1: Raw Water and Effluent Turbidity vs time for a flow rate of 100 m/day
A few things to note about the graph above:
In the first experiment, a flow rate of 100 m/day was used simply to get an estimate of what level of removal the filter foam material could acheive. 100 m/day was chosen as the flow rate since it is a typical upflow velocity for an AguaClara sedimentation tank. We used an influent raw water turbidity of 5 NTU, which is the typical turbidity of effluent water from an AguaClara sedimentation tank. Alum was not added to the system as we wanted to test the filtering capacity of the foam using the smallest level of particles that would be sent through the filter.
Figure 1: Raw Water and Effluent Turbidity vs time for a flow rate of 100 m/day
A few things to note about the graph above:
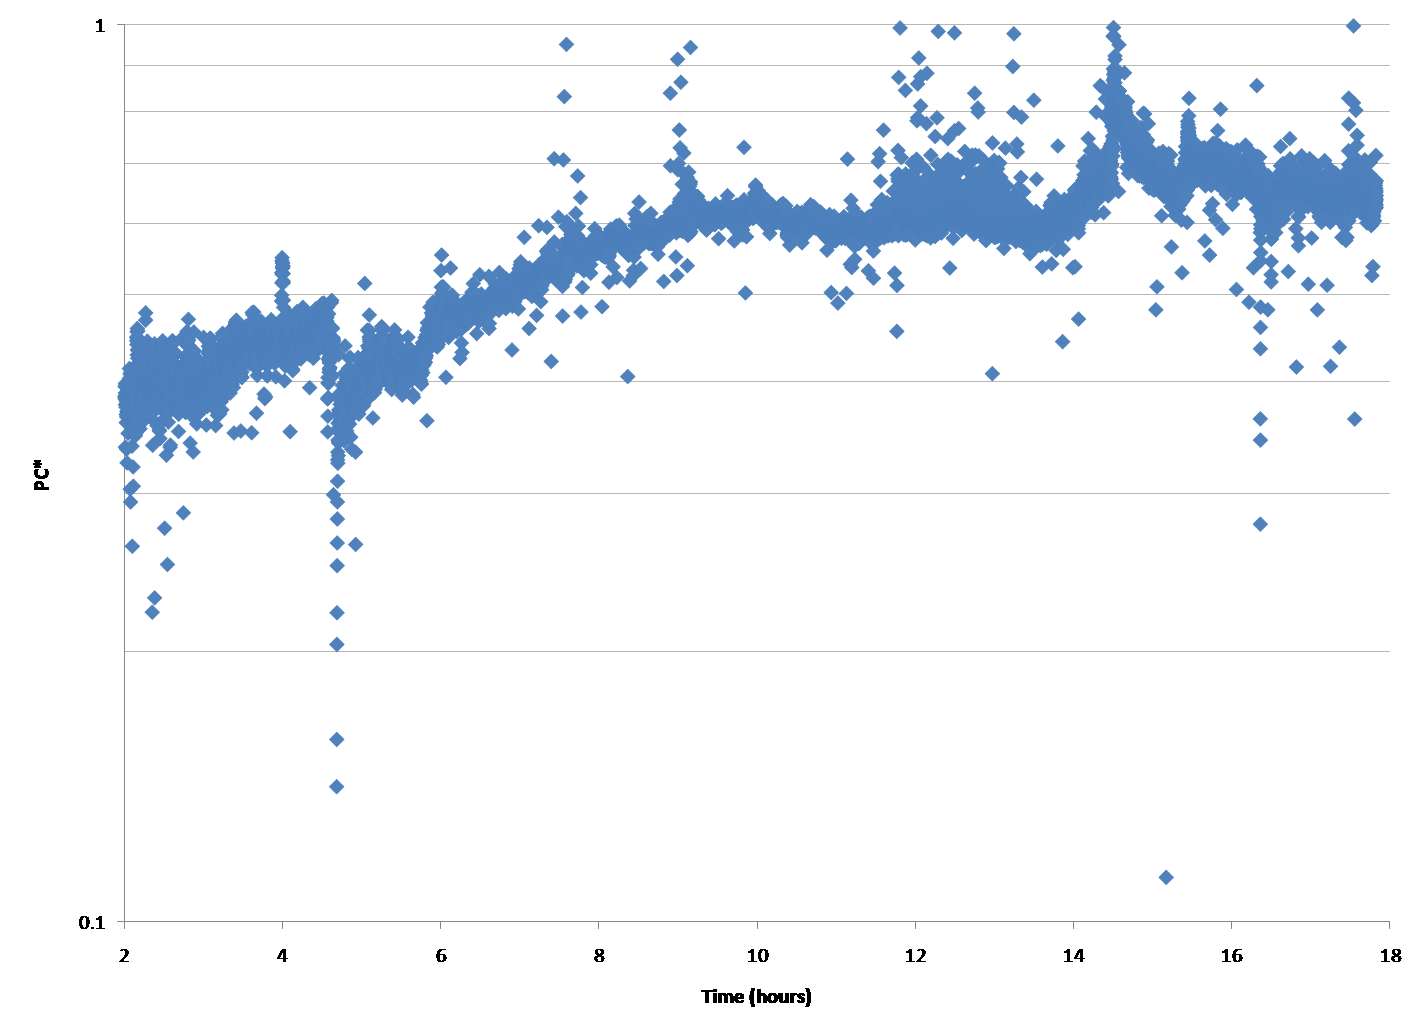
Figure 2: pC* vs time for a flow rate of 100 m/day
The graph above is a plot of pC*, which is the percent of colloide removal.
A few things to note:
Ultimately, we would like the filtration unit to take up the smallest amount of planned area possible. Therefore, we decided to increase the flow rate through the filter to 200 m/day, which is equivalent of reducing the top view area of the filter to half the original size. The influent raw water was kept as above, at 5 NTU with no alum dosage.
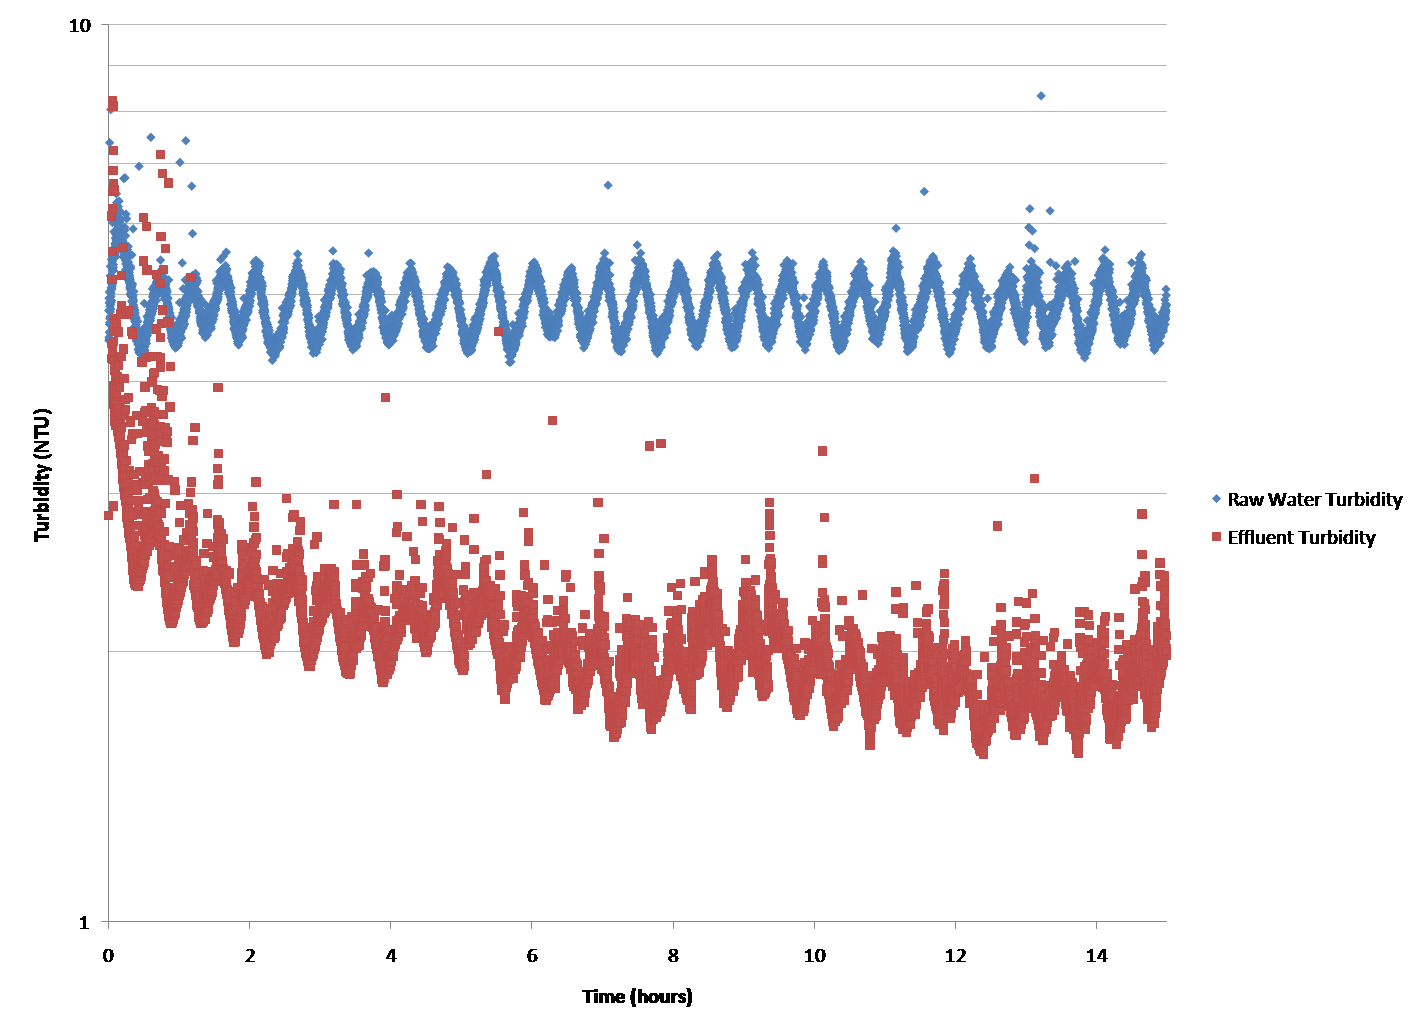
Figure 3: Raw Water and Effluent Turbidity vs time for a flow rate of 200 m/day
This graph indicates that the higher flow rate of 200 m/day increased the effluent turbidity to about 2 NTU. However, given the amount of planned space saved by this increase, this level of loss may be acceptable.
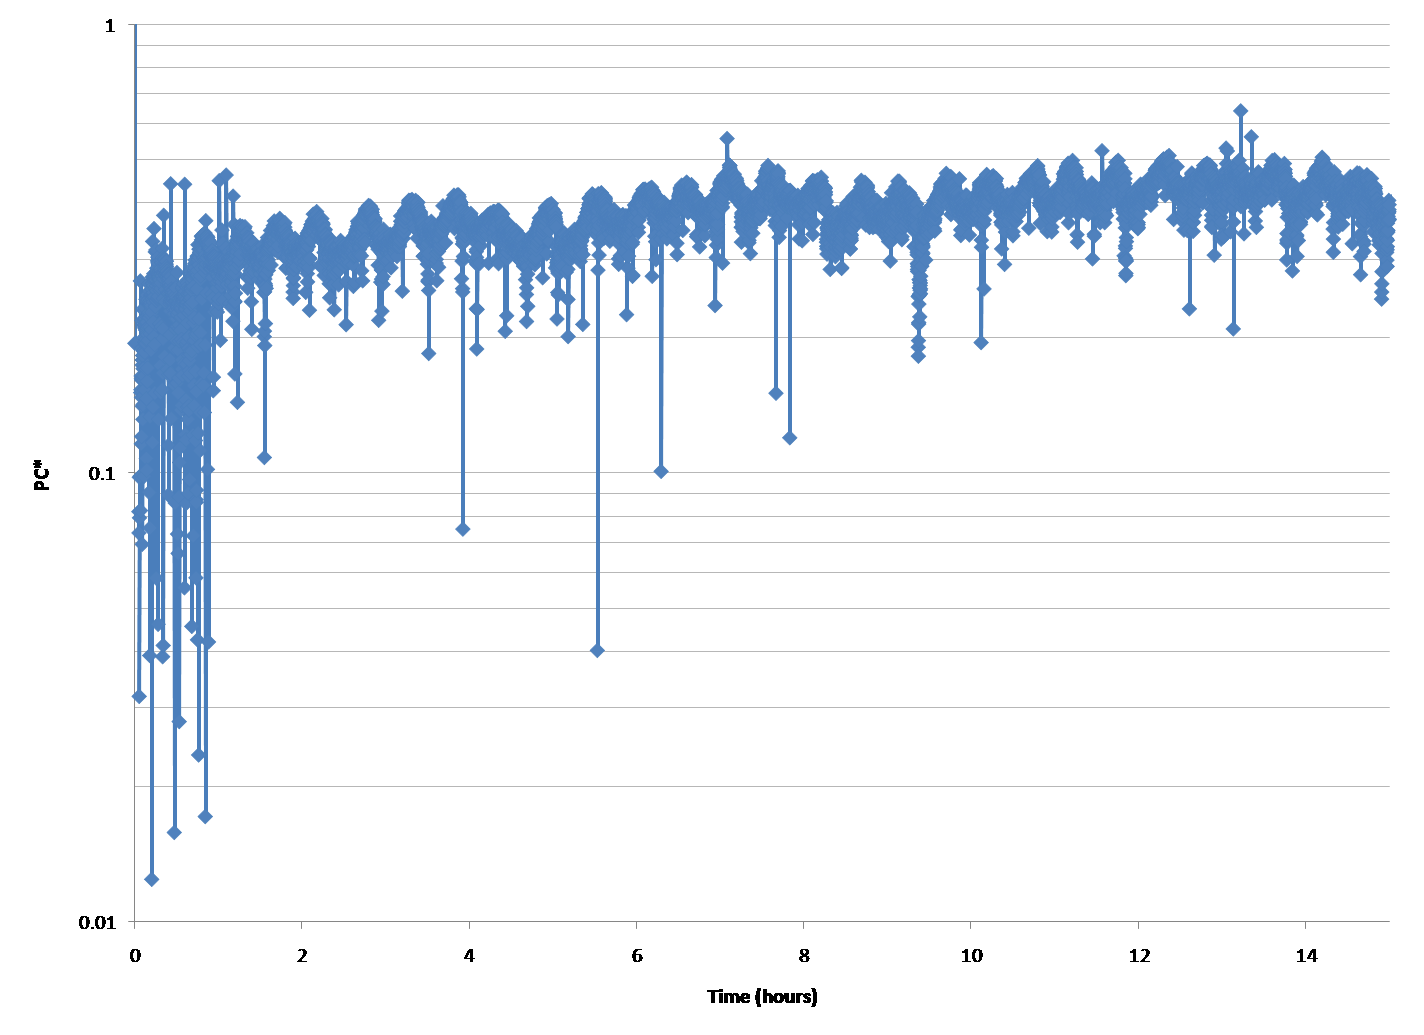
Figure 4: PC* vs time for a flow rate of 200 m/day
As expected, the percent colloide removal decreased with the increase in flow rate. At 200 m/day, only about 40% of colloides are removed. Again, we would optimally like to acheive a percent colloide removal of about 90%, therefore, we will investigate foam with a higher ppi (smaller pore sizes).