This is part of a series of tutorials. All tutorials up to the previous tutorial should have been completed.
Process Controller can
Make sure that all the valves and connections required to run your experiment are made. Your stamp box should look something like the figure below.
(insert picture of stamp box)
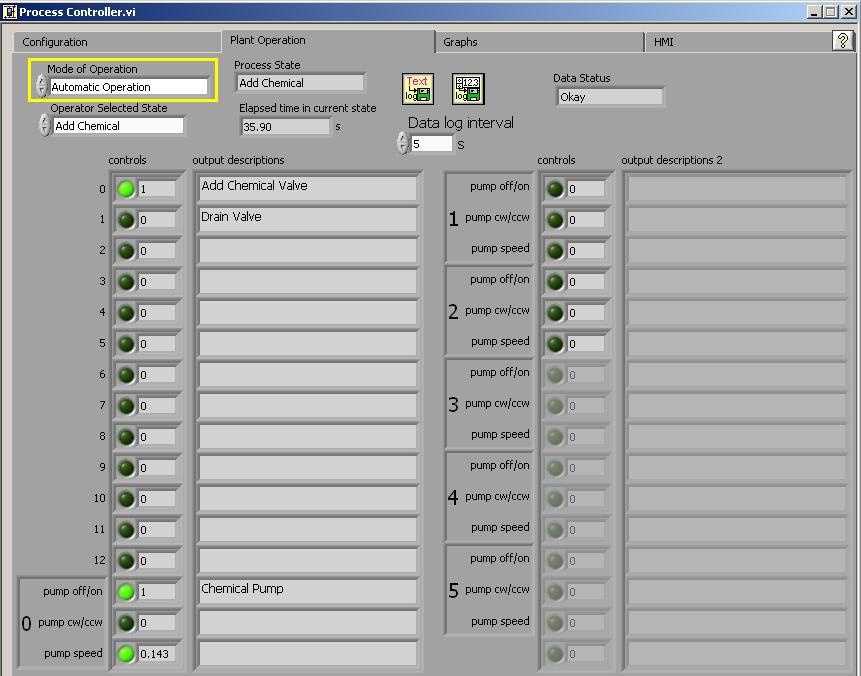
Set your process controller to automatic operation and select "Add Chemical" as your first state.
Note: You may encounter problems after doing this such as the pump is not pumping or a valve is not working or there is leaking
You should try to fix any problems as they arise and troubleshoot the experiment. Don't worry if you spill water, but clean it up as necessary.
As the experiment is running check to ensure that things are working properly.
You only need to complete one full cycle of data collection. The next step is to to open the datalog and statelog that contains your file. Using the file directory where you logged your data i.e. N:\Courses\AguaClara\FlocTube fall09, open the excel file datalog and the statelog for the date of your experimentation.
For this experiment we wish to plot the water level height in the tank over one cycle of the experiment (measured in elapsed time). Your first task is to create a graph of water level height in the tank over one tank cycle.
Follow standard format conventions:
Ensure that in your state log that you have cycled through the necessary states in process controller. There will be a time stamp of your team having done this.