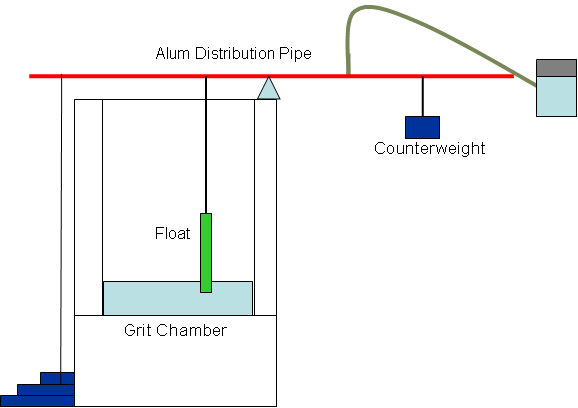
System with Floats and Weights
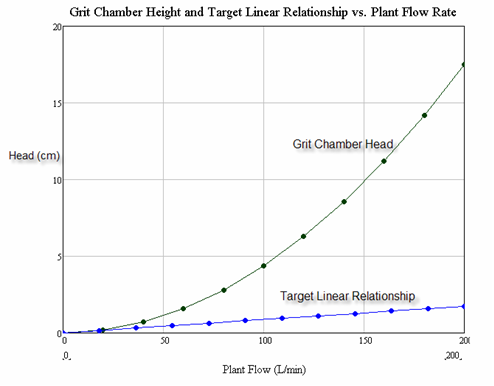
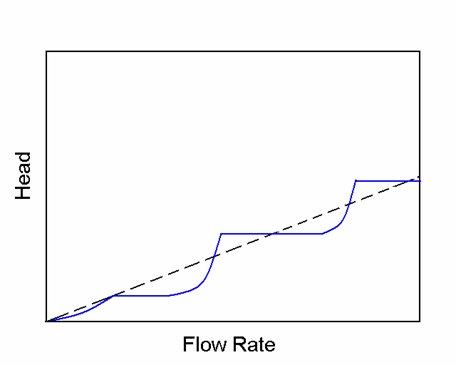
In this figure, the blue line represents the theoretical path of the float, following closely with the target linear relationship.
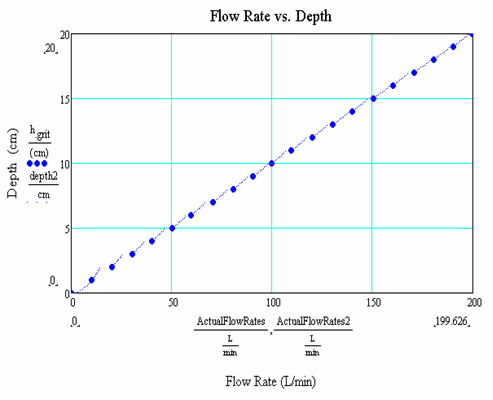
The Theoretical relationship between head loss in the grit chamber and plant flow rate
In this figure, the blue line represents the theoretical path of the float, following closely with the target linear relationship.