|
Author: Rajesh Bhaskaran & Yong Sheng Khoo, Cornell University Problem Specification |
Lift convergence plot can be used to compute the correct value of Strouhal number. Non-dimensionalize the problem and Sr = f*D/U = 0.0859 * 2 = 0.172. The results matches fairly well with the value 0.183 as reported by Williamson
|
Main Menu > Display > Contours
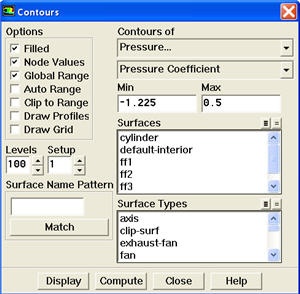
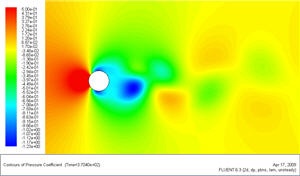
Under Contours of, choose Pressure.. and Pressure Coefficient. Select the Filled option. Increase the number of contour levels plotted. Set Levels to 100. Disable Auto Range and Clip to Range from the Options group box. Enter -1.225 and 0.5 for Min and Max, respectively.Click Display.
https://confluence.cornell.edu/download/attachments/107011458/pressure%20coefficient%20contour%20plot.jpg |
The contour shows a clear asymmetric pattern in the flow. The local pressure minima (the green patch downstream) are the center of the vortices.
Main Menu > Display > Contours
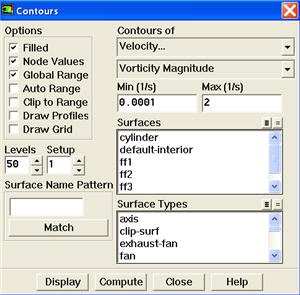
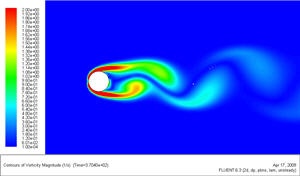
Under Contours of, choose Velocity.. and Vorticity Magnitude. Disable Auto Range and Clip to Range from the Options group box. Enter 0.0001 and 2 for Min and Max, respectively. Select Levels to 50. Click Display.
https://confluence.cornell.edu/download/attachments/107011458/vorticity%20magnitude%20contour%20plot.jpg |
This figure shows clear vortex shedding process. Zoom in the view around cylinder.
Go to Step 7: Validate the Results
See and rate the complete Learning Module
Go to all FLUENT Learning Modules