*** This version of Confluence is for testing only and contains a copy of content from June 29th 2026. No changes will be preserved. ***

 user-d6d20, last updated by user-3cd1a on May 07, 2008
3 minute read
user-d6d20, last updated by user-3cd1a on May 07, 2008
3 minute read
The experiments were performed to characterize the performance of the demo plant under various flow conditions, in terms of effluent turbidity.
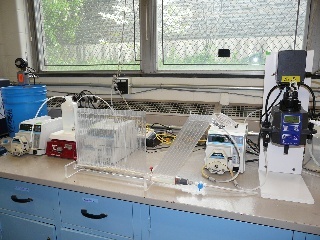
Process Controller, a software based on LabView and written by Dr. Monroe Weber-Shirk, is used to automate the experiment and record the data. The automation routine, written by James Leung, controls the power to the stirrers and the speed of the pumps, calculated from the plant flow and residence time parameters. All other parameters, such as alum dose and pump tubing sizes, are fixed and preset in the routine. Process Controller also records turbidity data at 5 s intervals to a tab-delimited text file.
The actual operating procedure is as follows:
The preparation state in Process Controller turns on the stirrers for 120 s to prepare the clay suspension and alum solution for the experiment. After 120 s, Process Controller automatically switches to the experiment state. This state turns on the peristaltic pumps to run the experiment. The stirrers are kept running to ensure consistency. The experiment is set to run for 3 residence times, after which Process Controller switches off all stirrers and pumps.
The demo plant was designed for a plant flow of 100 mL/min, with a residence time of 650 s. The above test was run for plant flows between 25 mL/min and 175 mL/min, at 25 mL/min intervals.
The graph below shows the effluent turbidities for various plant flows, plotted against dimensionless time, which is real time divided by the residence time of the plant at that plant flow. This is done for ease of comparison between different experimental flow rates. The effluent turbidities plotted are the average effluent turbidity values obtained through several experimental trials.
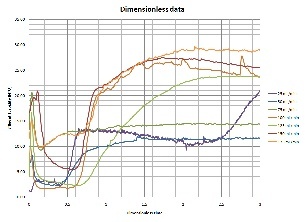
Most of the plots show a large spike in effluent turbidity near the beginning of each experiment. This is due to the experimental procedure and can be ignored. Between each experiment, the water in the turbidimeter was not cleaned out, temporarily resulting in an artificially raised turbidity at the beginning of each experiment. Thus, these spikes can be neglected in our analysis of the results.
The graphs show that as plant flow rate decreases, the effluent turbidity also decreases, until we reach 50 ml/min. At 25 ml/min, we found that the effluent turbidity is unstable but seems to be greater than that of 50 ml/min. From this, we conclude that the optimal flow rate of this flocculator and sedimentation tank is approximately 50ml/min.