*** This version of Confluence is for testing only and contains a copy of content from June 29th 2026. No changes will be preserved. ***

 user-f25a2, last updated on Jul 29, 2009
2 minute read
user-f25a2, last updated on Jul 29, 2009
2 minute read
This is an underdose. These graphs show the effluent turbidity plotted against time for capture velocities of 0.058, 0.116, 0.174, and 0.231 mm/sec.
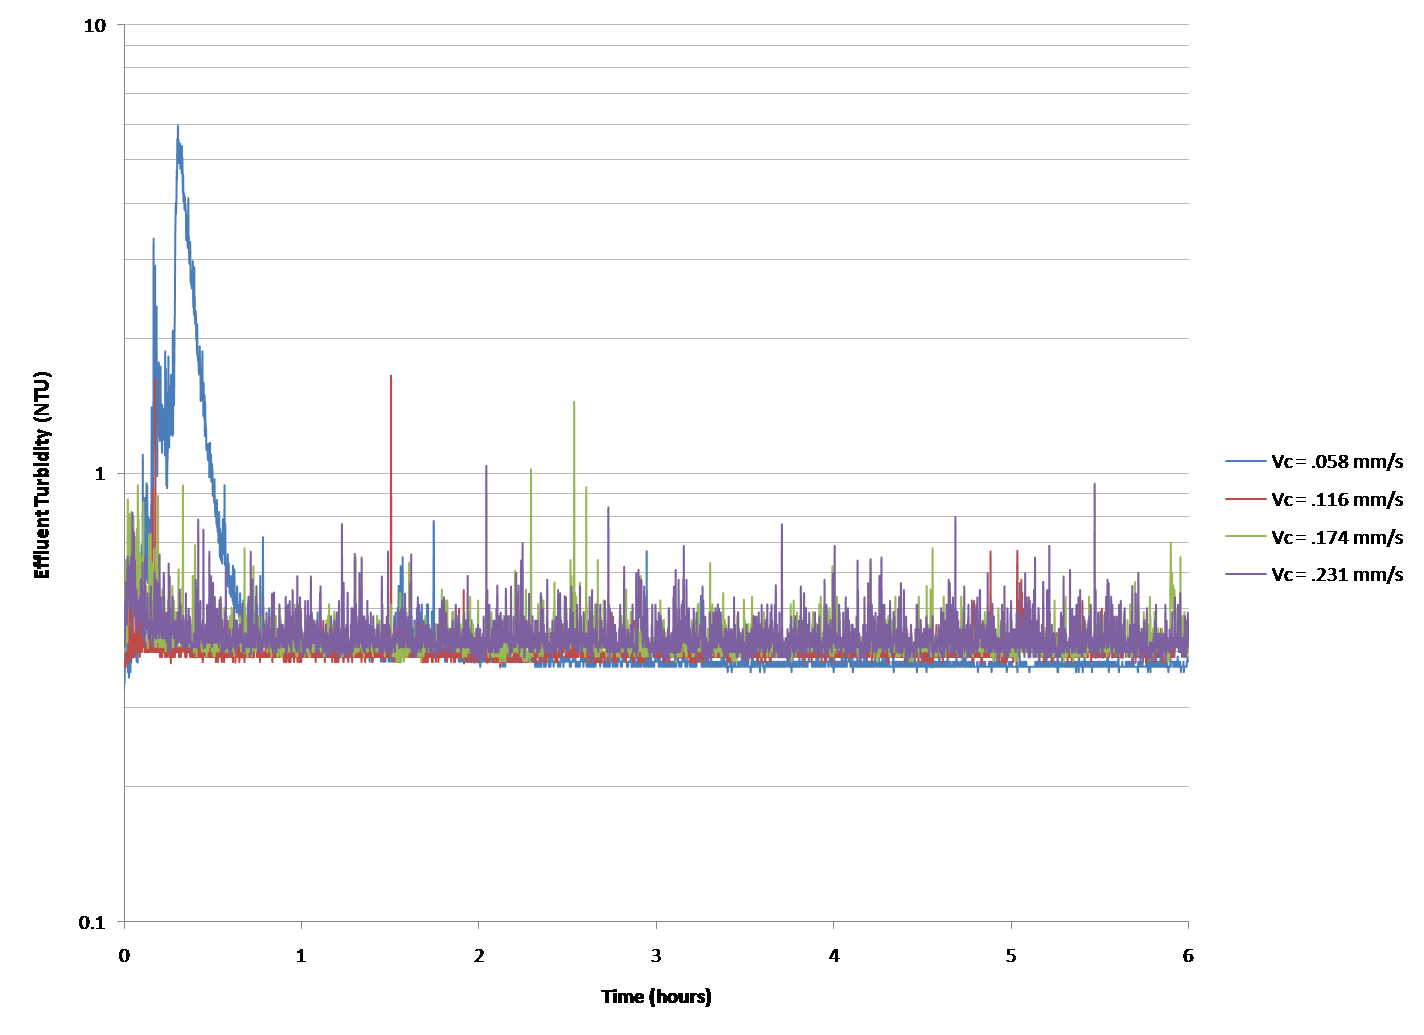
Figure 1: Effluent Turbidity vs. Time for Floc Blanket on low, alum dose = 15 mg/L
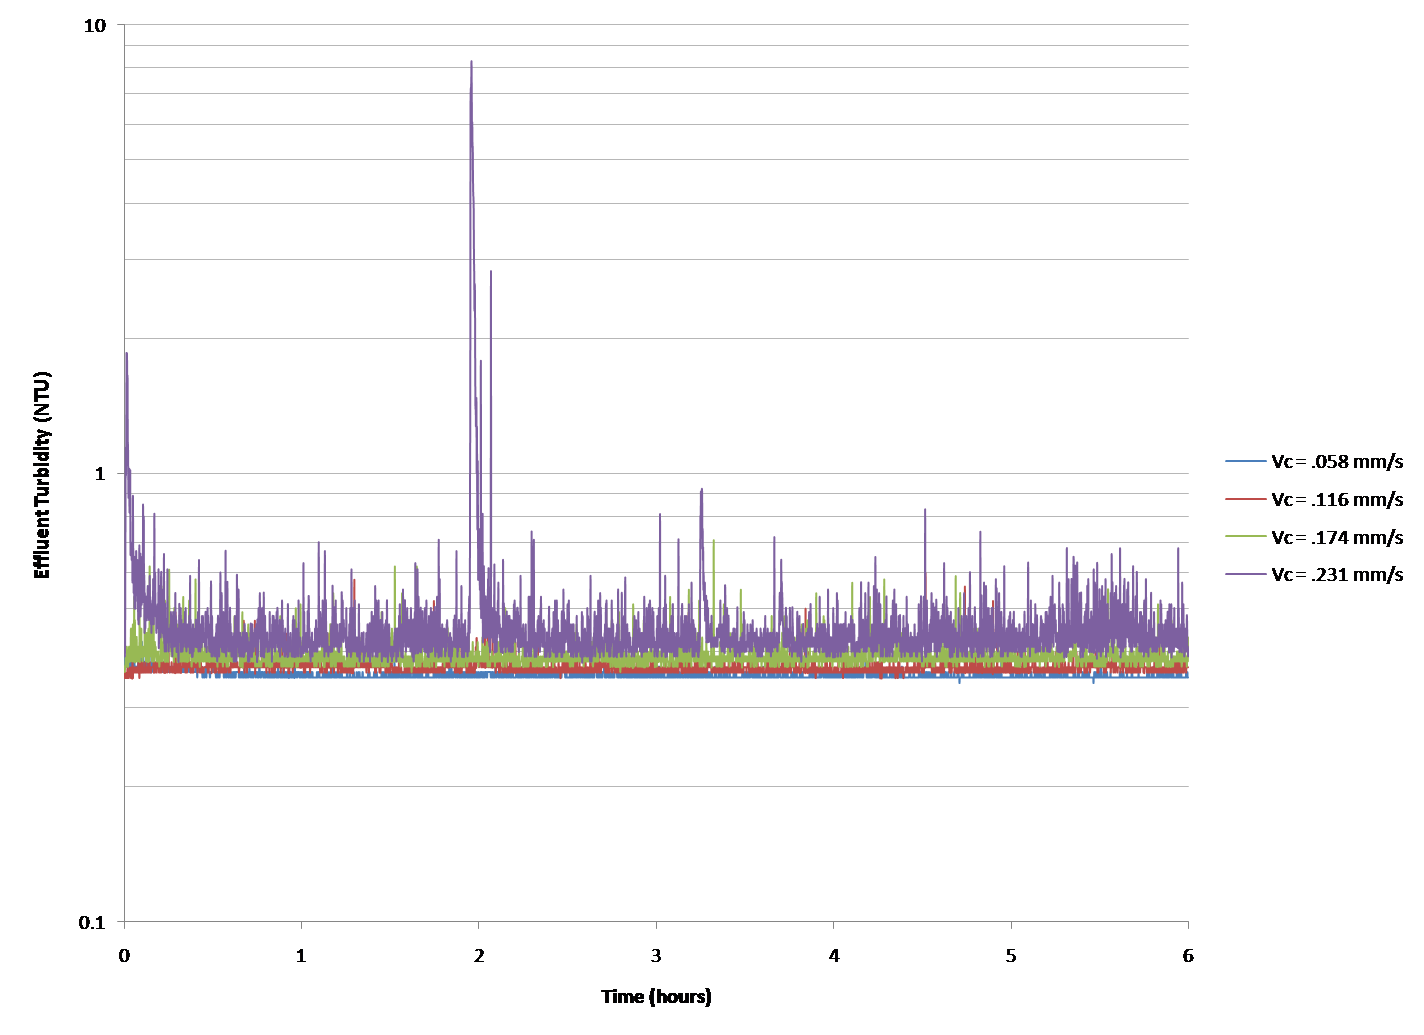
Figure 2: Effluent Turbidity vs. Time for Floc Blanket on high, alum dose = 15 mg/L
The floc blanket formed for this alum dose unexpectedly performed well. This dosage is an extreme underdose, and this experiment was run to demonstrate failure. An underdosed system forms flocs that are smaller, which creates a floc blanket that is more dense. As a result of the smaller flocs, the floc blanket takes more time to form since more flocs are required to fill the space in the tank. From the graph, it is clear that the floc blanket was not fully formed in the beginning of the 0.058 mm/sec capture velocity, because the effluent turbidity has a high spike. However, the turbidity ultimately falls back within the accepatble range. This point can be interpreted as the point at which the floc blanket is completely formed. Thus, as a result of this observation, it is clear that once the floc blanket is formed, regardless of the alum dosage, the ultimate effluent turbidity is relatively the same. From this, we can conclude that as long as the floc blanket is formed, the alum dose does not play an important role, and therefore the dosage can be lowered. It is important to have a high dose of alum as the floc blanket is forming, however, because a floc blanket at a low alum dose takes so long to form. This conclusion is significant because the overall amount of alum to treat the water needed can be reduced.