*** This version of Confluence is for testing only and contains a copy of content from June 29th 2026. No changes will be preserved. ***

...
At some point, the filter will become so clogged that the water level of the filter will begin to rise. Once the water level rises to a certain point, or the flow through the filter slows significantly, the filter has to be cleaned (how often this happens is usually plant and weather dependent). The plant operator will shut off the flow entering the filter and allow the remaining water to drain out. Next, the clear well valve is opened and the backwash water from the clear well will backwash the filter bed. This water fluidizes the sand particles in the filter, loosening the dirt particles caught in the sand and carries them into the backwash or sludge pipe. The backwash pipe will be at such an elevation so that the sand (which is larger and heavier than dirt particles) will remain in the sand filter. The clear well is designed so that as the last drop of water is flowing through the filter at the correct elevation to keep the sand particles elevated the target 30% for optimal cleaning. Once finished, the operator will close the backwash valve and begin filtration again or recharge the clear well. 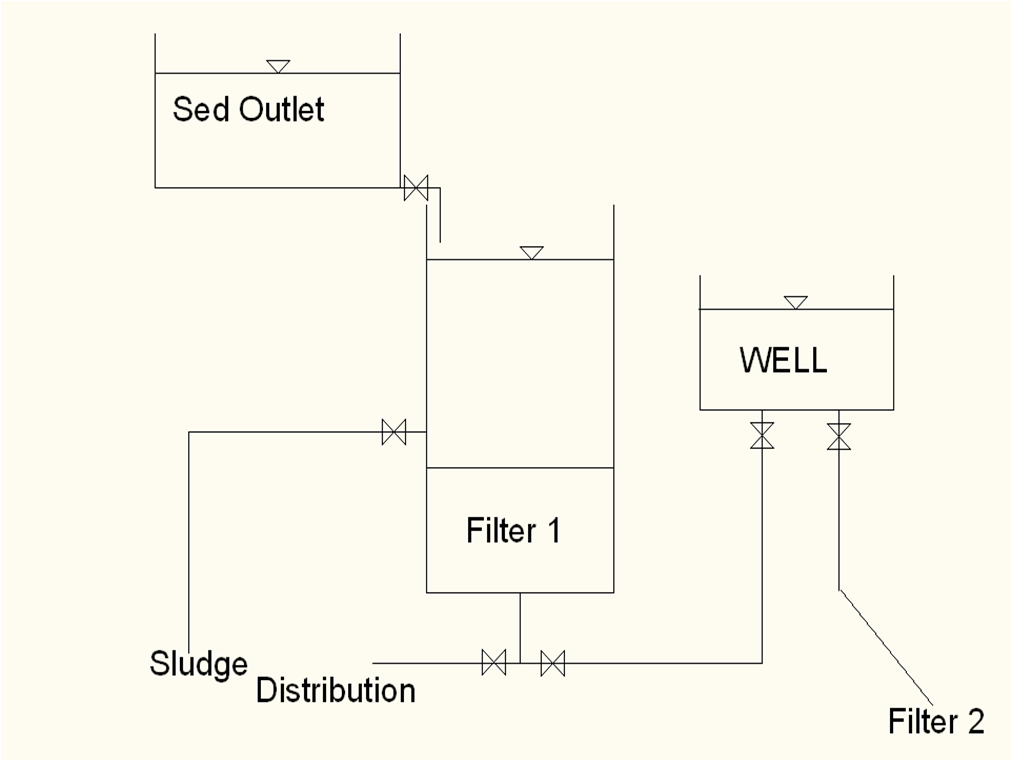
Figure 1: Clear Well Basic Concept
...
2) Develop a MATHCAD file that generates backwash and filtration design parameters
We needed this for both an actual AguaClara plant and a bench-scale or pilot plant model of the plant for testing.
MATHCAD File and description.
3) Experiments of bench-scale model to confirm design success
Bench scale modeling tests the effectiveness of a filtration design by shrinking the design parameters of the system (filter bed depth, filter bed surface area, and etc) to a smaller scale that is easier to test. For example, we would simulated a filter bed of 50 cm of sand with 5 cm of sand with the porosity and specific gravity of the sand being constant. This would also enable us to test the validity of the empirical equations that are behind our design.
...
Below are rough proportional sketches of the plan view and side view representations of the clear well and two filters that we propose to build from the conservative design. These are pictured in relation to the flocculator and sedimentation tank at Agalteca.
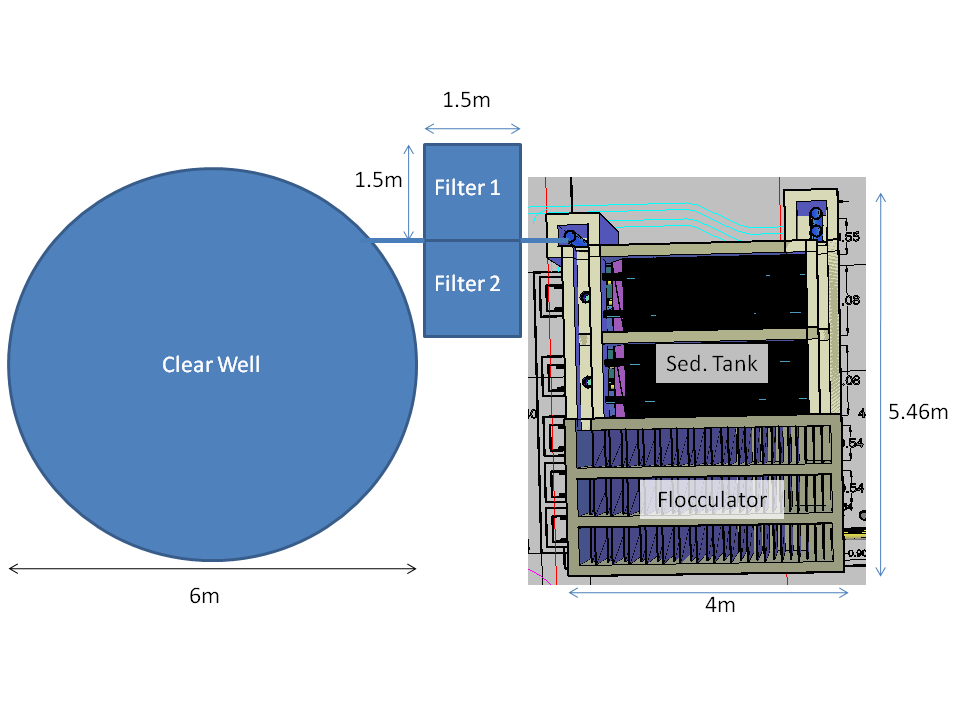
Figure 2: Plan View of Agalteca Plant with Filter Design
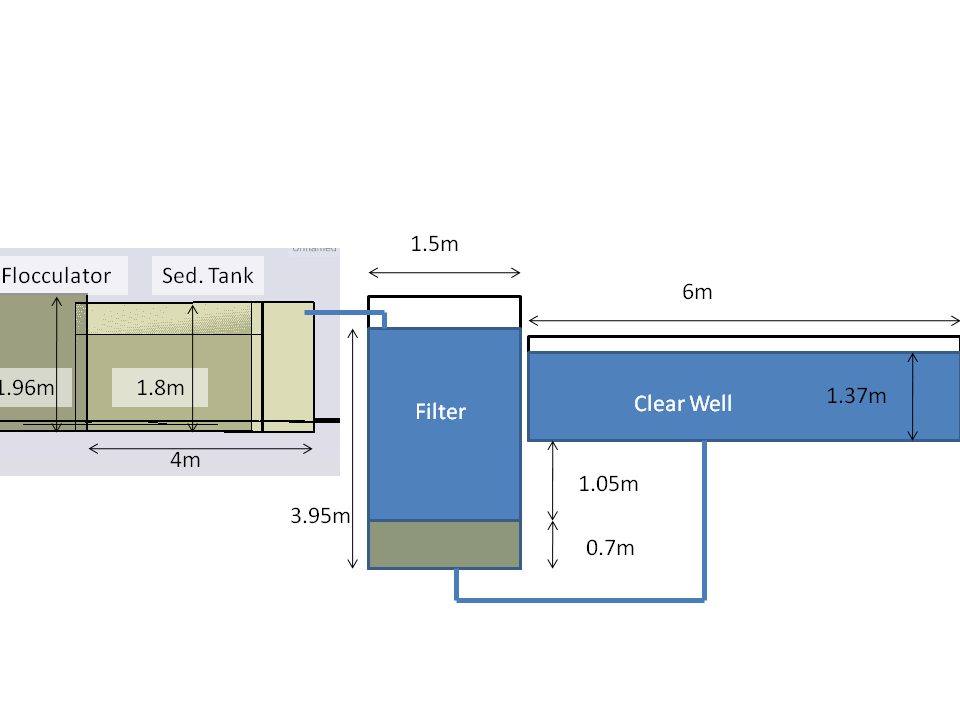
Figure 3: Side View of Agalteca Plant with Filter Design
1) Our design based on simple hydraulics will work. However, it is a very large filter (see exact dimensions in Figure 2) and will not be sustainable economically. The material cost for construction will be too high.
2) The design based on the empirical Weber equation is smaller and less expensive. However, the validity of the empirical equations is not yet certain, in spite of our Fluidization Velocity Experiment. Therefore more testing needs to be done in pilot scale models.
3) If the empirical equations are valid, then we can change parts of the design, by changing the sand parameters. For example, lower the dimensions of the clear well by lowering the backwash velocity by decreasing the d60 and specific weight of the media. (see Fluidization Velocity Experiment for more specifics)
Experiment Results
We had mixed results with regards to Weber's equation for filter bed expansion. At low levels of filter bed expansion, the Weber equation accurately predicted the fluidization velocity required to achieve the targeted bed expansion. As the target bed expansion increased, so did the degree of error. At 9% expansion, the degree of error was at 14%. At 30% expansion (our target expansion), the degree of error was 110%.
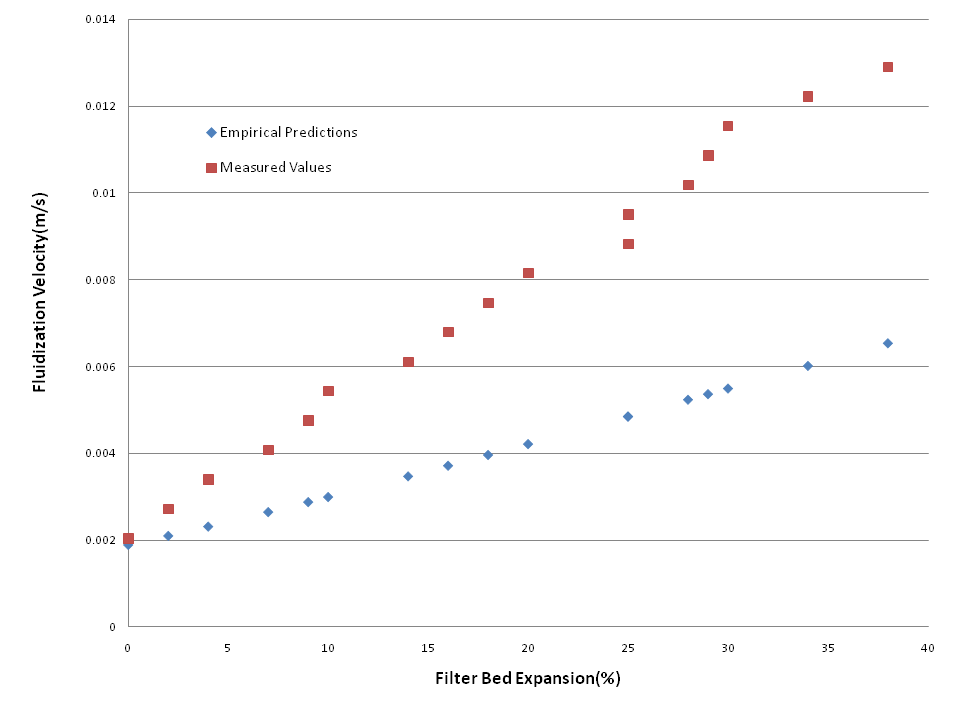
Figure 4: Error Between Measured and Estimated Fluidization Velocities
...