*** This version of Confluence is for testing only and contains a copy of content from June 29th 2026. No changes will be preserved. ***

According to the predictive flocculation model proposed by Swetland et. al., 2012, large flocs do not significantly contribute to turbidity removal -- only small colloids can collide effectively and aggregate to a size that will be removed by sedimentation. Based on the hypothesis that "large “large flocs are useless"useless”, a floc breakup procedure was devised. Results obtained using a coiled tube flocculator and flocculation residual turbidity analyzer (FReTA) shows that higher turbidity removal was achieved after breaking the flocs, comparing to results using the same method but without floc breakup. Therefore breaking flocs at regular intervals to maintain continuous growth will promote better performance of flocculation. This research finding provided a good reference for future hydraulic flocculator design.
...
1. Only laminar flow occurs in tube flocculators.
2. Colloids cannot attach to large flocs at maximum size thus we need to break those flocs to maintain continuous growth.
3. At low coagulant doses, the residual turbidity is relatively high because the attachment efficiency is not big enough to allow flocs to form. With the increase of coagulant dose, attachment efficiency rises so the residual turbidity is lowered.
4. Discrete settling is assumed in analysis of data since the distance Z is much less than the 0.5m interval between sampling ports used in conventional flocculant settling tests.
5. Flocs will collide and grow when they travel from one breakup position to another.
6. Broken flocs can aggregate with small colloids with the same attachment efficiency.
All experiments conducted are using the same method recorded in AguaClara's archive with the following directory: N://files.cornell.edu/EN/aguaclara/RESEARCH/Tube Floc/Spring 2012/Experiments/6-29-2012.
...
Note: A power law relationship is used to set a range of alum dose to spread out the residual turbidity vs. dose curve. This equation shows how we set the dose of alum: !Picture4.png|width=300! 
Where max reps means the number of experimental cycles, which is set by operators.
A floc breakup procedure was devised according to the calculations of energy dissipation rate, capture velocity, collision time. Six hose clamps were evenly placed onto tube flocculator (2 on each unit, see figure 1). The inner diameter of clamps are calculated based on the maximum energy dissipation rate. After the floc breakup device were was set up, the flocculator were was cleaned using a tiny sponge to remove the clay that sticked to the walls of flocculator. Then a complete experiment with the same method as the control experiment was conducted. 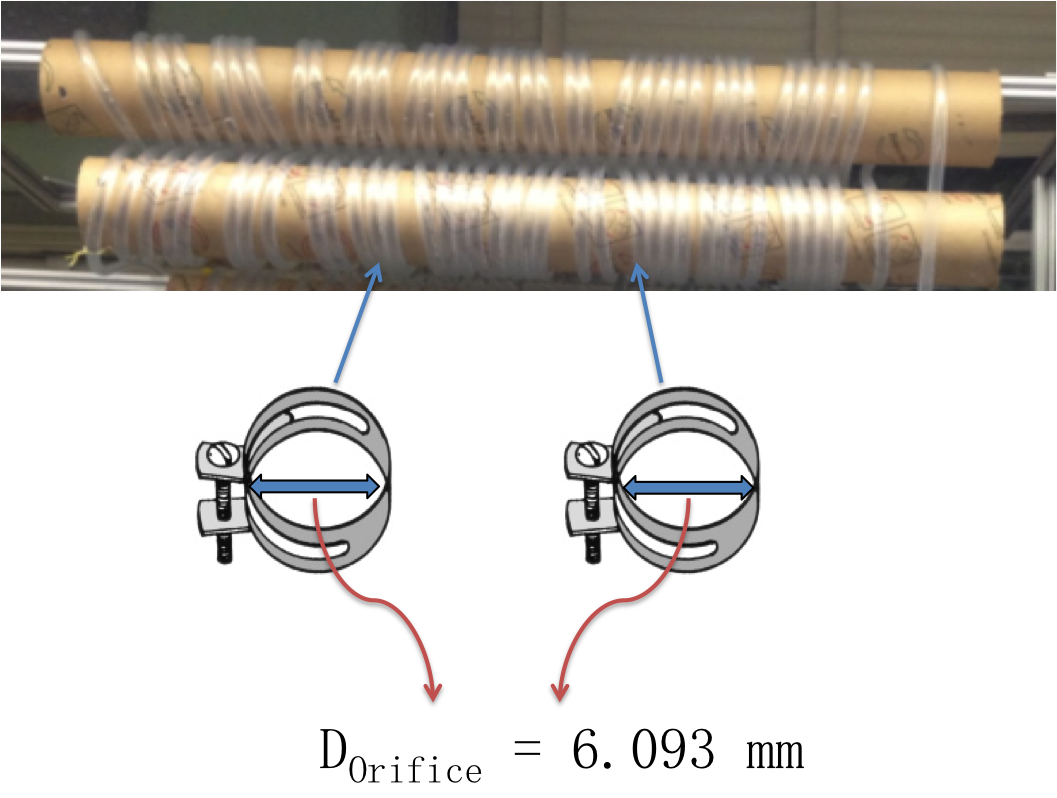
.
...
Figure 2 demonstrates the compared comparative results of residual turbidity with floc breakup and without floc breakup. Obviously, the residual turbidity are lower when breaking the flocs using clampsis lower after floc breakup device was installed. At the alum dose 4, 4.6 and 5.2 mg/L, the difference of residual turbidity curve between the 2 groups of data reaches 10 NTU. Both curve seems to fit into the logarithmic trend line -- the one with floc breakup matches the trend line even with a correlation coefficient of 0.9934. The results not only proves indicate that our hypothesis "large “large flocs are useless" is right but also offers us useless” may be correct and offers insight into improving AguaClara's current flocculator design.
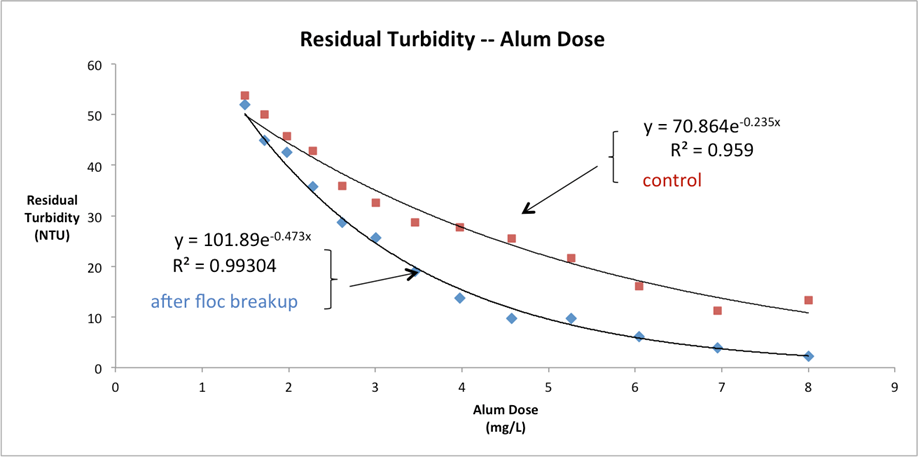
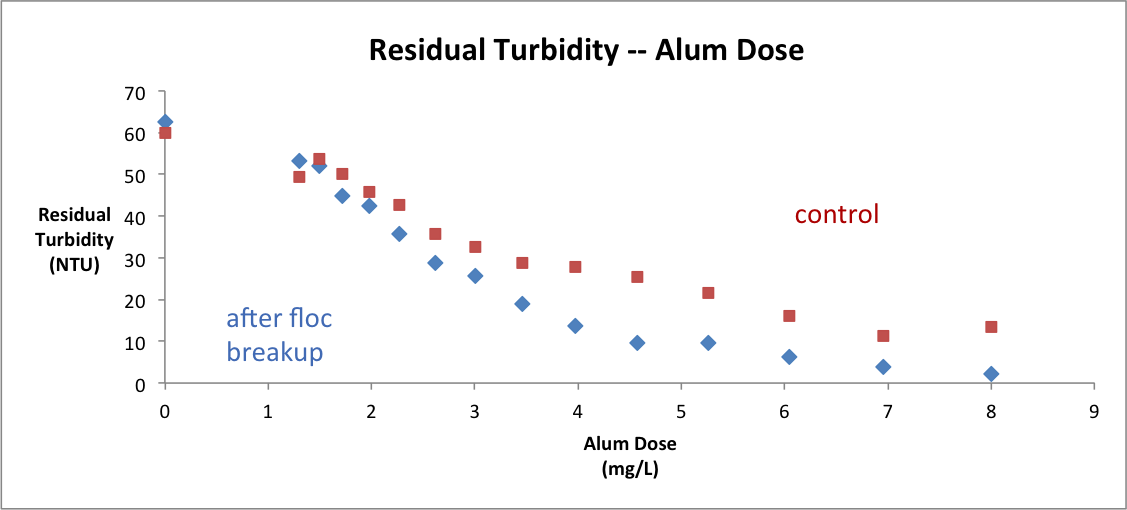 Figure 2 Comparative results of residual turbidity vs. alum dose
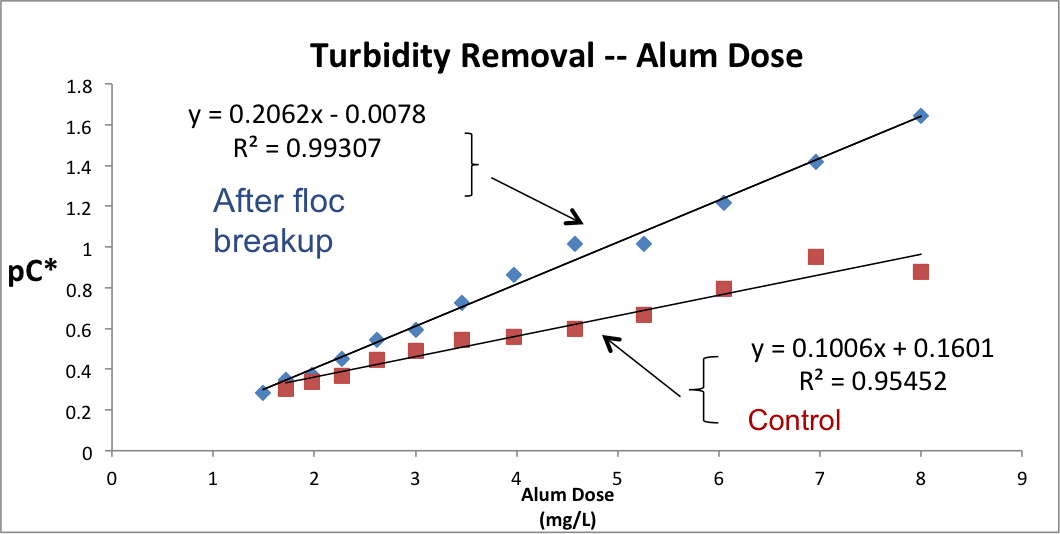
The Predictive model is supposed to be updated based on the experimental data after floc breakup device was installed. An approach to update existing model is to insert trend line to our existing experimental data and pick the best relationship for turbidity removal versus alum dose curve. Next we need to check how variables are changed after installation of floc breakup.
...
(Note: 2 experiment points at the beginning were not shown due to graphical trend line fitting)
The capacity of flocculator is based on it's ability to cause collisions between particles. Breaking large flocs that allow more collisions to happen may be helpful to achieve higher turbidity removal. Thus we need to design a special component that can break up flocs at regular intervals. For laboratory experiments, this special component can be an orifice or a wire mesh set at a size that correlates with the desired energy dissipation rate.