 Sign-up for free online course on ANSYS simulations!
| Include Page | ||||
|---|---|---|---|---|
|
| Include Page | ||||
|---|---|---|---|---|
|
Post Processing
Plot Velocity Vectors and Contours
| HTML |
|---|
<iframe width="560" height="315" src="https://www.youtube.com/embed/DCbh6z1v1wY" frameborder="0" allow="accelerometer; autoplay; encrypted-media; gyroscope; picture-in-picture" allowfullscreen></iframe> |
Note: In the below video (Plot Pressure Contours), please note that the cursor disappears accidentally at the 44 second mark and returns at the 3 minute mark. At 1 minute 17 seconds, "here" refers to the bottom-middle of the region near the plate. It is later drawn at the 1 minute 28 second mark. At 2 minute 40 seconds, "here" refers to the left most face, known as the inlet face, of the region.
Plot Pressure Contours
| HTML |
|---|
<iframe width="560" height="315" src="https://www.youtube.com/embed/KRQ0rtKCJ3w" frameborder="0" allow="accelerometer; autoplay; encrypted-media; gyroscope; picture-in-picture" allowfullscreen></iframe> |
Plot Velocity Profiles
| HTML |
|---|
<iframe width="560" height="315" src="https://www.youtube.com/embed/t3p52LPLw-A" frameborder="0" allow="accelerometer; autoplay; encrypted-media; gyroscope; picture-in-picture" allowfullscreen></iframe> |
Explanation for Velocity Profile Overshoot
| HTML |
|---|
<iframe width="560" height="315" src="https://www.youtube.com/embed/LnIsw07iuew?rel=0" frameborder="0" allowfullscreen></iframe> |
Check Similarity Principle
| HTML |
|---|
<iframe width="560" height="315" src="https://www.youtube.com/embed/Qde3pryaQ2A" frameborder="0" allow="accelerometer; autoplay; encrypted-media; gyroscope; picture-in-picture" allowfullscreen></iframe> |
Plot Velocity Derivatives
| HTML |
|---|
<iframe width="560" height="315" src="https://www.youtube.com/embed/kn6zk0AWsps" frameborder="0" allow="accelerometer; autoplay; encrypted-media; gyroscope; picture-in-picture" allowfullscreen></iframe> |
Calculate Drag Coefficient
| HTML |
|---|
<iframe width="560" height="315" src="https://www.youtube.com/embed/YrMyfB6n_W0" frameborder="0" allow="accelerometer; autoplay; encrypted-media; gyroscope; picture-in-picture" allowfullscreen></iframe> |
Go to Step 7: Verification & Validation
| Panel |
|---|
Author: John Singleton and Rajesh Bhaskaran, Cornell University Problem Specification |
| Note | ||
|---|---|---|
| ||
This page of this tutorial is currently under construction. Please check back soon. |
| Info | ||
|---|---|---|
| ||
Click here for the FLUENT 6.3 version. |
Step 6: Results
Velocity Vectors
...
https://confluence.cornell.edu/download/attachments/118771111/VectPlot_Full.png...
https://confluence.cornell.edu/download/attachments/118771111/VectPlot2_Full.pngOutlet Velocity Profile
...
https://confluence.cornell.edu/download/attachments/118771111/xyplotsetup_Full.png...
https://confluence.cornell.edu/download/attachments/118771111/SolXY1_Full.png...
https://confluence.cornell.edu/download/attachments/118771111/XVelPlot1_Full.png...
https://confluence.cornell.edu/download/attachments/118771111/Curv2_Full.png...
https://confluence.cornell.edu/download/attachments/118771111/AxesMen1_Full.png...
https://confluence.cornell.edu/download/attachments/118771111/Axes2_Full.png...
https://confluence.cornell.edu/download/attachments/118771111/Plot5_Full.png...
https://confluence.cornell.edu/download/attachments/118771111/Plot6_Full.png...
Pressure Coefficients
...
https://confluence.cornell.edu/download/attachments/118771111/CompInlet_Full.png...
https://confluence.cornell.edu/download/attachments/118771111/ContPlot_Full.png...
https://confluence.cornell.edu/download/attachments/118771111/Contou_Full.png...
https://confluence.cornell.edu/download/attachments/118771111/ContP1_Full.png...
https://confluence.cornell.edu/download/attachments/118771111/ContZoom_Full.pngSkin Friction Coefficient
...
https://confluence.cornell.edu/download/attachments/118771111/SolXY3_Full.png...
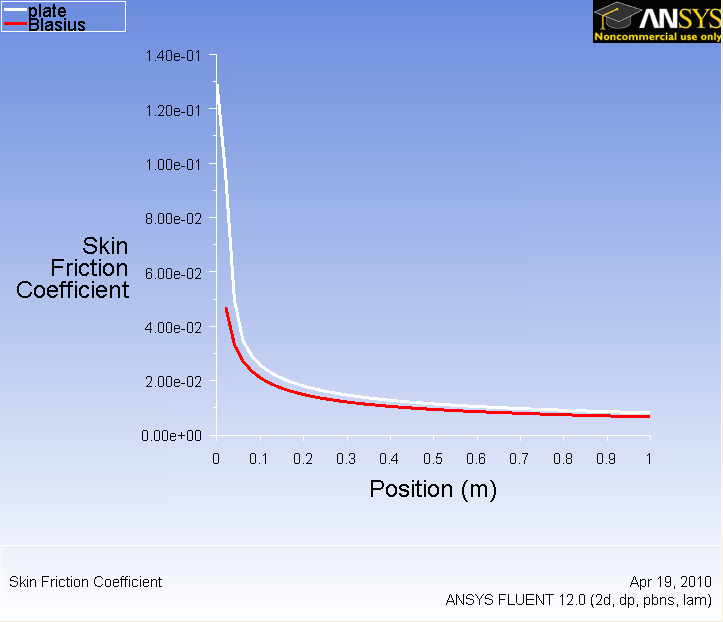
https://confluence.cornell.edu/download/attachments/118771111/SkinFric1_Full.pngNow, compare your solution to the with the Blasius solution's skin friction by loading the file and then plotting it with your solution. (Download file here)
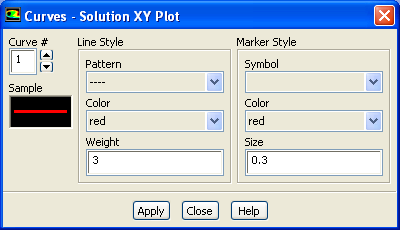
Also, you can change the symbol into lines by going to Curves... and click on the corresponding pattern that you like. Increase the Weight to 3 for readability. Both results should be fairly similar.
...
https://confluence.cornell.edu/download/attachments/118771111/step6_007.png?version=1Drag
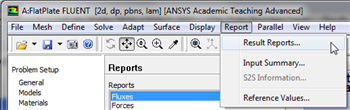
Now, we will obtain the drag on the plate. First, click on Report then click on Result Reports..., as shown in the following image.
newwindow
https://confluence.cornell.edu/download/attachments/118771111/Report_RR_Full.png
https://confluence.cornell.edu/download/attachments/118771111/ForceRep_Full.pngGo to Step 7: Verification & Validation
See and rate the complete Learning Module