*** This version of Confluence is for testing only and contains a copy of content from June 29th 2026. No changes will be preserved. ***

In Experiment 2 we investigated the effect of alum dosage on flocculator performance. The procedure for Experiment 1 contains information on the general setup used in this experiment. We used the same setup as in Experiment 1, but instead of varying flow rate, we varied the alum dosage. The plant flow rate was held constant at 5 mL/s (what is this shear rate?), and we used influent turbidities of 100 NTU and 500 NTU and three different flocculator lengths (28 m, 56 m, and 84 m).
To investigate alum dosage at a given turbidity and length, we planned to run two experiments. The first experiment would vary the alum dosage over a large range in larger intervals while holding the plant flow rate (shear), influent turbidity, and residence time constant. Then we planned to run a second experiment varying the alum dose across the best performing interval from the first experiment with small increments in order to determine the optimal dose.
For a flocculator length of 28 m, we began by testing water with an influent turbidity of 100 NTU. The alum dosage was varied from 20-60 mg/L in increments of 5 mg/L for each run. The alum dose was varied in process controller using the increment function shown in Figure 1:
FIGURE 1: Process Controller setpoints used to vary the alum dose.
The data was analyzed using the same methods as in Experiment 1.
However, since the optimal alum dosage for 100 NTU water has been well characterized by previous experiments and our the interval our data identified (see Results and Discussion) generally agreed with the known value of 45 mg/L, we did not continue with the second test at 100 NTU to narrow the optimal dose range and instead tested 500 NTU water. For the 500 NTU water, we maintained the same flow rate of 5 mL/s and flocculator length of 28 m. However, this time we varied the alum dose from 40 mg/L to 120 mg/L in increments of 10 mg/L. We then analyzed the data using the same methods as before.
We plan to continue our investigation of alum dose by performing a second experiment with 500 NTU water to find optimal dose based upon the best interval from our previous experiment. We will then repeat the process of varying alum dose over large intervals, and then narrowing to an optimal dose for 5, 25, 50, 100, and 500 NTU -water-water at extended flocculator lengths of 56 m and 84 m, or double and triple the length of the current flocculator.
The following Process Controller Files were used for the 100 NTU and 500 NTU tests.
100 NTU Test File
500 NTU Test File
The goal of this experiment is to study the effects of different alum doses and flocculator lengths in order to discover find the most effective way to improve the design performance of the actual AguaClara flocculator. However, before beginning any analysis, we must first be aware of the characteristics of a good flocculator. What defines a good flocculator? A good flocculator must: first, have large enough resulting flocs at the end of the flocculator so that they will weigh down, sink, and settle out in the sedimentation tank; second, have this floc size under control to an optimal size-too large flocs will not facilitate floc blanket formation as they will settle out before the floc particles could ever become fluidized; and third, have a low resulting A well performing flocculator produces flocs of certain sizes that can settle in the sedimentation tank or aid in the formation of a floc blanket resulting in a low effluent turbidity indicating the production of clean water.
The use of alum facilitates is necessary to this process ; however, too much alum can create oversize flocs that settle out before reaching the sedimentation tank. In addition, the over use of alum will be expensive; cost efficiency is an important factor to be considered in building the AguaClara flocculatorand optimizing alum dosage will be more cost effective in running the AguaClara plant. To find an ideal alum dosage for a particular influent turbidity, in our experiments, we have varied the alum doses at a certain range and are going to see within certain ranges to verify which dosage works best for each situation. The same goes In addition to the different flocculator lengths; overly long flocculators will cause flocs to settle out before reaching the sedimentation tank and in addition will not be cost efficient. To find an ideal length, we have set up three apparatuses with varying tube lengths: 2796 cm, 5600 cm, and 8800 cm. For each alum dosage range, we will change the use of alum, the optimization of the flocculator's length is critical. The length of the flocculator in order to find the ideal combination of flocculator length and seems to have an influence on the optimum alum dose.
There are two important graphs that give Through experiments, we aim to find the best overview of the experiment: the gamma PDF graph and the residual turbidity graph. The gamma PDF graph shows the probability of reaching a certain floc size for each run of experiment with varying alum dosage. The y-axis represents the probability and the x-axis represents the floc size. The residual turbidity graph is the gamma PDF graph focused at a certain range of sedimentation velocity. We chose this range based on our knowledge on capture velocity. Capture velocity is the minimum speed flocs must be in for them to settle in the sedimentation tank; any particle with a smaller velocity than this will not sink. Given that the capture velocity is 0.12 mm/sec, the residual turbidity graph focuses on the flocs that fail to reach this velocity. The turbidity from these particles shows the resulting turbidity produced after flocculation.
On November 12, 2009, an experiment was conducted with the turbidity set around 5 NTU, flocculator length of 2796 cm, flow rate of 5 mL/s, and alum dosage ranged from 10 to 50 mg/L.
The data processor was unable to fit the sedimentation velocity vs. turbidity curve into a gamma pdf graph,because the trend of our mean turbidities was not following a gamma distribution(Figure _A). We suspect that it could not fit because of a low influent turbidity of 5 NTU, and how our lowest mean effluent turbidity was less than ideal at 1.978 NTU.
1
FIGURE 1: The graph plots the residual turbidity vs. sedimentation velocity for each Alum dose ranging 10 mg/L~50 mg/L
On November 17, 2009, an experiment was conducted with the turbidity set around 5 NTU, flocculator length of 8800 cm, flow rate of 5 mL/s, and alum dosage ranged from 10 to 50 mg/L.
Looking at the gamma pdf curve(Figure 2B) we see that trace 1 which corresponds to an alum dosage of 10 mg/L has a really high turbidity rate of 1.171 NTU which is unusually higher than all the others, and demonstrates a very narrow distribution. However, looking at the residual turbidity graph (Figure 2B), the resultant turbidity this dosage gave did not differ significantly from all the others. In fact trace 7 (corresponding to an alum dosage of 40 mg/L seems to give in the highest resultant turbidity at this range of sedimentation velocity we are looking at. Figure 2B also shows that for traces 2 and 4 (alum dosages of 15 and 25 mg/L, respectively) have wider distributions than the other alum dosages. Overall there seems to be discrepencies between the data correlating cohesively between the two graphs. From the values of mean turbidity at settling state, from 10 to 45 mg/L the mean turbidity seemed to start at a value of .608 NTU then rise to about .725 at 25mg/L, then rises to .829 and then back down to .755 at 35 mg/L (Table 1).
2A
2B
FIGURE 2A: The graph plots normalized turbidity vs. sedimentation velocity for each Alum dose ranging 10 mg/L~50 mg/L; FIGURE 2B: The graph plots the residual turbidity vs. sedimentation velocity for each Alum dose ranging 10 mg/L~50 mg/L
On November 11, 2009, an experiment was conducted with the turbidity set around 25 NTU, flocculator length 2796 cm, flow rate of 5 mL/s, and alum dosage ranged from 10 to 50 mg/L.
In the gamma PDF graph (Figure 3A), the alum dosage 10 mg/L showed a larger distribution of floc sizes with more probability to produce smaller flocs. In addition, looking at the residual turbidity graph (Figure 3B), the resultant turbidity this dosage gave was significantly higher than the rest. The residual turbidity graph also showed the alum doses 15 mg/L and 20 mg/L to be producing a slightly higher resultant turbidity. From the values of mean turbidity at settling state, starting from the alum dosage 35 mg/L, the mean turbidity seemed to be settling down to a constant value around 2.5 NTU.
3A 3B
FIGURE 3A: The graph plots normalized turbidity vs. sedimentation velocity for each Alum dose ranging 10 mg/L~50 mg/L; FIGURE 3B: The graph plots the residual turbidity vs. sedimentation velocity for each Alum dose ranging 10 mg/L~50 mg/L
On October 20, 2009, an experiment was ran with the set up of influent turbidity around 100 NTU, flocculator length of 2796 cm, flow rate of 5 mL/s, and an alum dosage ranging from 20 to 55 mg/L. The data obtained from this experiment was processed through Mathcad for a simplified overview of the results in graphic form.
Looking at the gamma PDF graph (Figure 4A), the alum dosage of 20 mg/L gave a widely distributed probability of reaching different floc sizes with a comparably low probability to reach its highest sedimentation velocity. In addition, the residual turbidity graph (Figure 4B)showed a high turbidity for this alum dose in its lower velocity range. Thus the alum dose 20 mg/L seems to be inefficient for this particular influent turbidity and flow rate. The mean turbidity resulting from alum dose 55 mg/L seems to be out of normal range; its NTU value is significantly lower than the values given from the previous, lower alum dosages. Hence, the result from this dosage is doubtful. Overall, after the alum dose of 35 mg/L (except for 55 mg/L), the mean turbidity seemed to be settling down to a constant value around 1.4 NTU.
4A 4B
FIGURE 4A: The graph plots normalized turbidity vs. sedimentation velocity for each Alum dose ranging 20 mg/L~55 mg/L; FIGURE 4B: The graph plots the residual turbidity vs. sedimentation velocity for each Alum dose ranging 20 mg/L~55 mg/L
On November 18, 2009, an experiment was ran with the set up of influent turbidity around 100 NTU, flocculator length of 8800 cm, flow rate of 5 mL/s, and an alum dosage ranging from 20 to 55 mg/L.
5A
5B
FIGURE 5A: The graph plots normalized turbidity vs. sedimentation velocity for each Alum dose ranging 20 mg/L~55 mg/L; FIGURE 5B: The graph plots the residual turbidity vs. sedimentation velocity for each Alum dose ranging 20 mg/L~55 mg/L
On Oct 27, 2009, another experiment was conducted with the turbidity set around 500 NTU, flocculator length 2796 cm, flow rate of 5 mL/s, and alum dosage ranging from 10 to 90 mg/L. The data was run through Mathcad to get a simplified graphic overview of the result.
In both graphs (Figure 6A, Figure 6B), the alum dosage 10 mg/L gave a comparably different result from the rest; it produced a significantly higher settling turbidity and a large amount of smaller flocs. The overall mean turbidity for this dosage was almost twice the following dosages. After the alum dose 50 mg/L, the mean turbidity seemed to be settling down to a constant value around 2.5 NTU.
6A 6B
FIGURE 6A: The graph plots normalized turbidity vs. sedimentation velocity for each Alum dose ranging 10 mg/L~90 mg/L; FIGURE 6B: The graph plots the residual turbidity vs. sedimentation velocity for each Alum dose ranging 10 mg/L~90 mg/L
On Nov 19, 2009, another experiment was conducted with the turbidity set around 500 NTU, flocculator length 8388 cm, flow rate of 5 mL/s, and alum dosage ranging from 10 to 90 mg/L. The data was run through Mathcad to get a simplified graphic overview of the result.
As shown in Figure 7A, there is no big differences between the floc size distribution except for the lowest alum dose. As the previous experiment (500 NTU, length 2796 cm), the distribution is narrow wich means that we are producing flocs of almost the same size. Besides, the mean floc size seems to be the same than previously.
7A
7B
FIGURE 7A: The graph plots normalized turbidity vs. sedimentation velocity for each Alum dose ranging 10 mg/L~90 mg/L; FIGURE 7B: The graph plots the residual turbidity vs. sedimentation velocity for each Alum dose ranging 10 mg/L~90 mg/L
combination of alum dosage and flocculator length that performs most efficiently.
Residual Turbidity Analysis
Results from 5 NTU experiments:
Both of our replicates (Fig. 1) for a flocculator of 28 m showed close agreement. Starting at a residual turbidity close to 5 NTU with an alum dose of 10mg/L, the residual turbidity dropped with increasing alum dose until it appeared to hit a limiting value of about 0.8 NTU with an alum dose of 50 mg/L. After this point, increasing alum dose no longer appeared to have an effect on residual turbidity. We hypothesize that initially, the flocs grow larger as alum dose is increased; the alum works as expected to cause the smaller particles to stick together and form larger flocs. However, as the flocs grow in size, they become larger, less dense and therefore more susceptible to breakup due to shearing forces. At a certain point. adding further coagulant can no longer hold the large flocs together, and the shearing forces cause them to begin breaking up. As a result, flocs cannot continue to grow larger, and as a consequence residual turbidity stops decreasing.
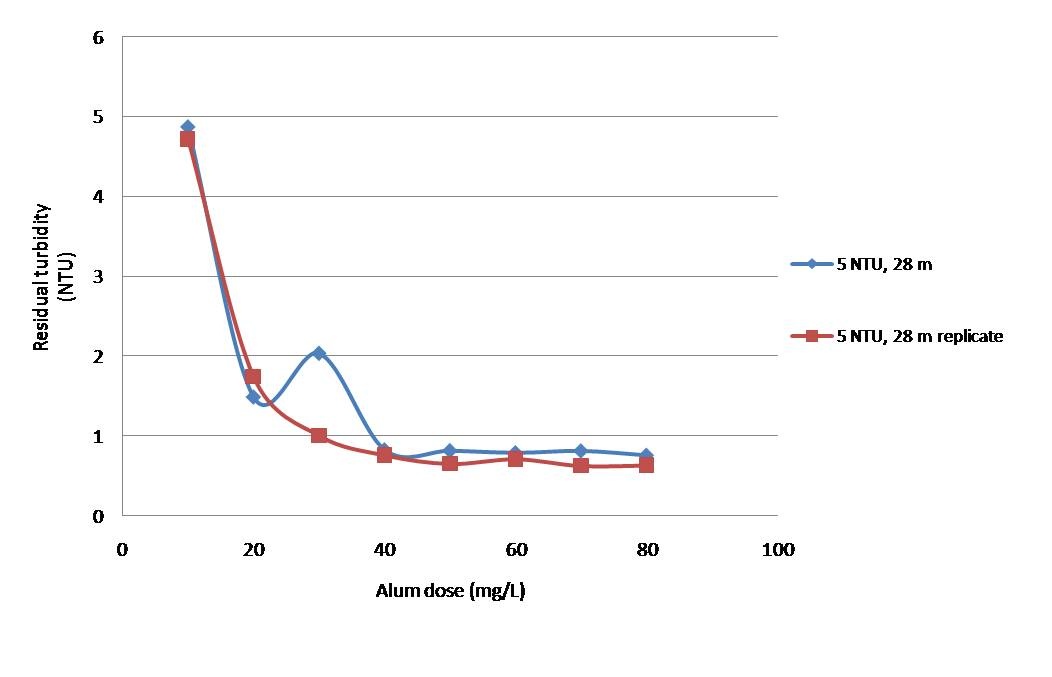
Figure 1: Residual turbidity vs. alum dose for 5 NTU influent water for a flocculator length of 2796cm.
For a flocculator length of 84 m, we focused on the lower alum dosages to see how the residual turbidity plot developed; experiments with higher alum dosages tended to show relatively constant residual turbidities around the minimum value achieved with low dosages (Fig.2). Here we see a similar trend to what was observed at 28 m, although the two replicates have a significantly different values at lower alum dosages. We suspect this is due to limits in the calibration of the pumps, combined with the possibility of blockages in the alum line and variations in influent turbidity, making it difficult to achieve consistent results at such low alum dosages.
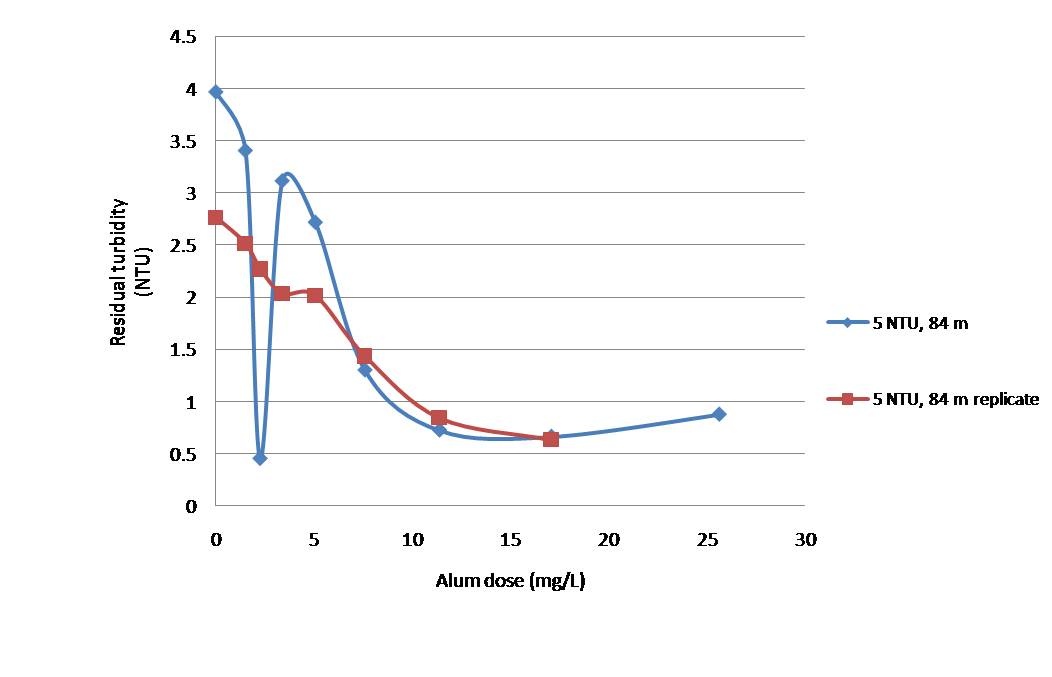
Figure 2: Residual turbidity vs. alum dose for 5 NTU influent water for a flocculator length of 8388cm, focusing on lower alum dosages.
It appears that both flocculator lengths achieve similar minimum residual turbidity values of around 0.7 NTU (Fig. 3). However, the longer flocculator is able to achieve this with much lower alum dosages than the shorter one. Since shear rate was held constant, we hypothesize that the increased residence time of the longer flocculator allowed the flocs to grow larger with less alum since they had more time to collide before reaching the settling column. Although the minimum residual turbidity was achieved with lower alum dosages in the longer flocculator, it appears that increasing the length of the flocculator did not result in a lower residual turbidity than could otherwise have been achieved with the shorter flocculator using higher alum dosages. The dose of alum required to achieve an effluent turbidty of 1 was reduced by 30 mg/L to 10 mg/L by increasing Gθ from 22951 to 68853.
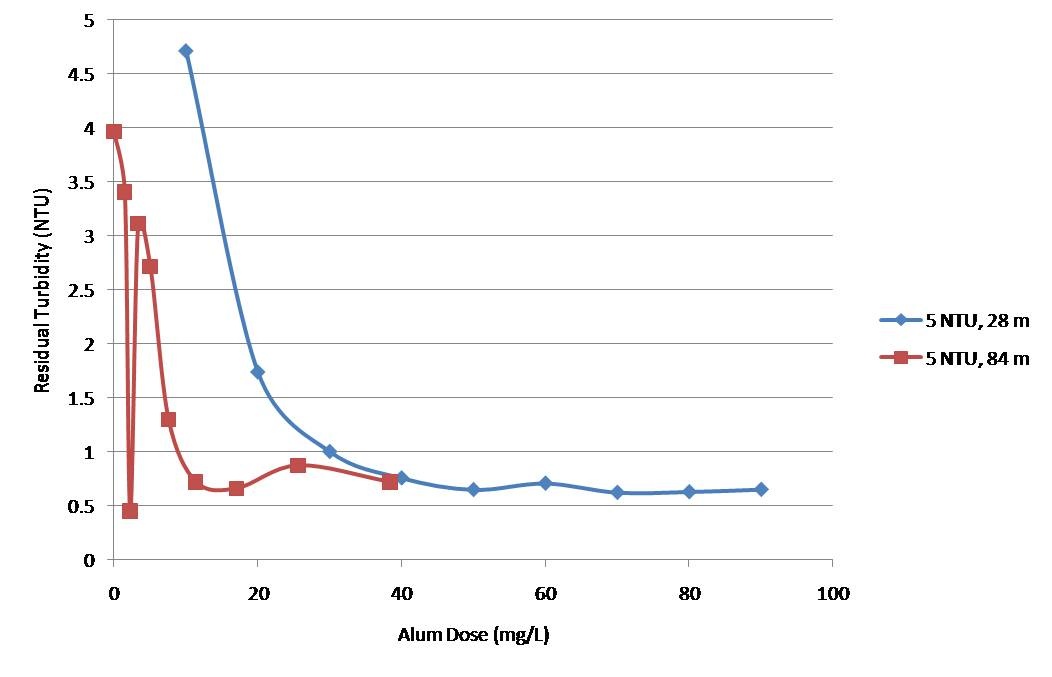
Figure 3: Comparison of residual turbidity vs. alum dose for two different flocculator lengths of 2796cm and 8388cm.
Results from 100 NTU experiments:
With 100 NTU water and a flocculator length of 28 m, we see a similar behavior to what was observed with 5 NTU influent water (Fig. 4). The residual turbidity starts out high before approaching a minimum value. However, this minimum residual turbidity increased from 0.6 NTU for 5 NTU water to 0.9-1 NTU for 100 NTU water. This is likely due to the fact that there is about 20 times as much clay initially as the 5 NTU experiments, making it much more difficult to achieve the same minimum residual turbidities.
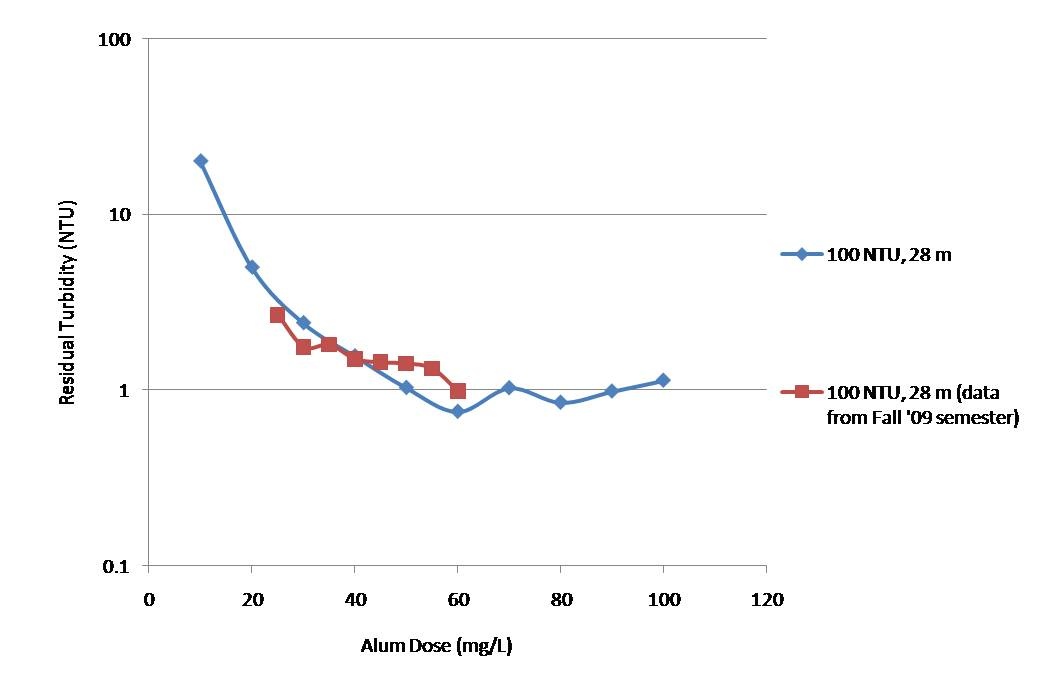
Figure 4: Residual turbidity vs. alum dose for 100 NTU influent water for a flocculator length of 2796cm. A logarithmic scale is used on the residual turbidity axis to show details of the minimum residual turbidity achieved.
Both replicates at 56 m (Fig. 5) show the characteristic decay of residual turbidity to a limiting value. However, they do not agree at the low alum dosages; the second replicate shows a much lower residual turbidity for comparable alum doses at the low end of the curve. We suspect that there may have been a blockage in the alum line during the first experiment resulting in this irregularity. This is because alum doses as high as 20 mg/L produced a residual turbidity of around 80 NTU, much higher than would be expected. We then hypothesize that the blockage cleared by the fourth data point in the second replicate, and as a result both replicates achieved similar limiting residual turbidities of around 0.8 NTU.
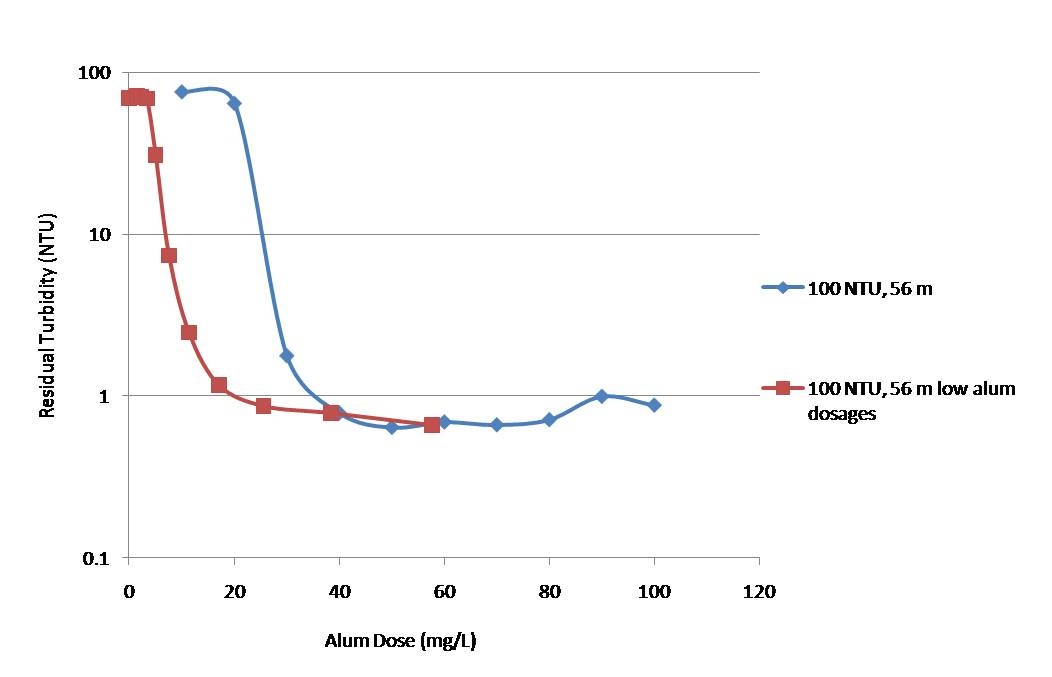
Figure 5: Residual turbidity vs. alum dose for 100 NTU influent water for a flocculator length of 5592cm. A logarithmic scale is used on the residual turbidity axis to show details of the minimum residual turbidity achieved.
The three replicates of a flocculator length of 84 m at 100 NTU show reasonable agreement, as well as the same characteristic decay of residual turbidity observed in previous experiments (Fig. 6). However, the minimum residual turbidity achieved averaged around 1.6-2 NTU, significantly higher than observed at the previous two lengths. It appears that for a flocculator length of 84 m, the floc breakup behavior becomes more dominant, resulting in elevated residual turbdities.
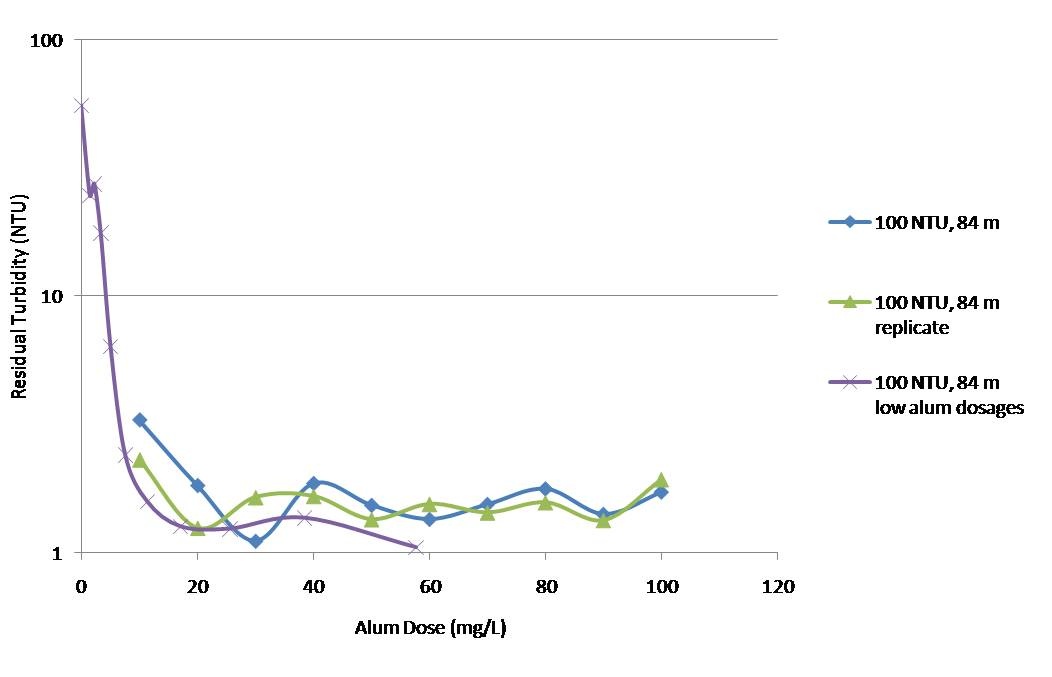
Figure 6: Residual turbidity vs. alum dose for 100 NTU influent water for a flocculator length of 5592cm. A logarithmic scale is used on the residual turbidity axis to show details of the minimum residual turbidity achieved.
Comparing characteristic replicates from each of the three flocculator lengths, the same trend as seen with 5 NTU influent water is observed (Fig. 7), as the flocculator length is increased, a lower the alum dose is needed to achieve the minimum residual turbidity. When the flocculator is increased from 28 m to 56 m, the minimum residual turbidity decreases slightly from about 0.9 NTU to about 0.8 NTU. However, when it is further increased to 84 m, the residual turbidity jumps up to around 1.8 NTU. Therefore, it appears that while increasing flocculator length can produce favorable results as seen in the decrease in alum dose needed to achieve similar residual when comparing the two shorter lengths, further increases can be detrimental to flocculation performance.
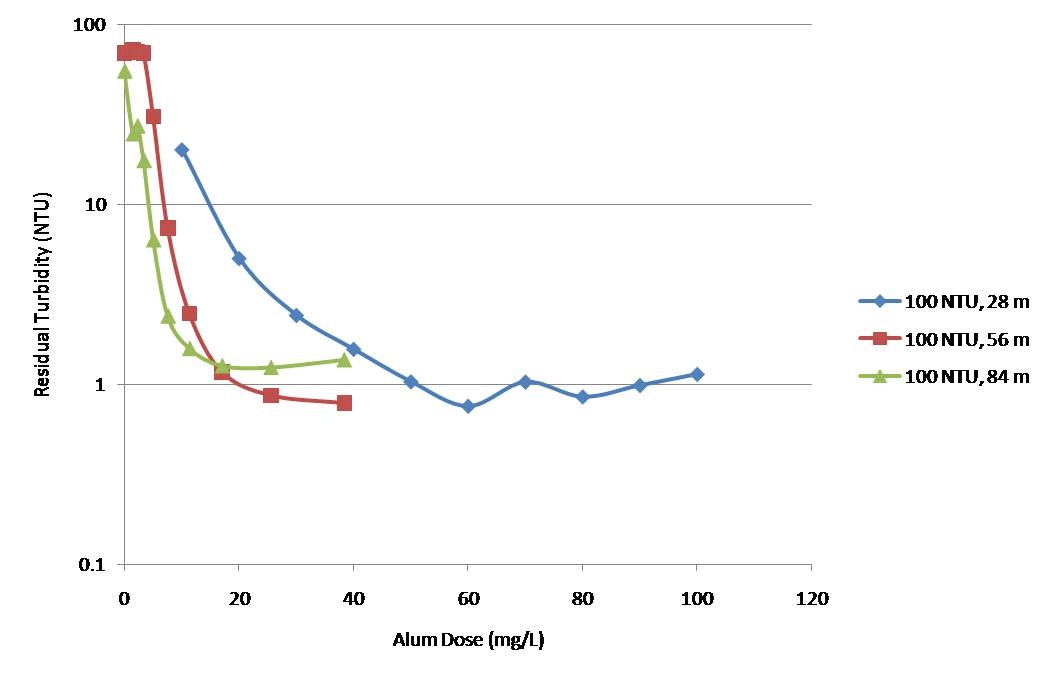
Figure 7: Comparison of residual turbidity vs. alum dose for three different flocculator lengths of 2796cm, 5592cm, and 8388cm with influent water at 100 NTU. A logarithmic scale is used on the residual turbidity axis to show details of the minimum residual turbidity achieved.
Results from 500 NTU experiments:
For the 500 NTU experiments, similar minimal residual turbidities were achieved using flocculator lengths of 28 m and 8388cm of around 2 NTU. Additionally both showed similar behaviors to what was observed before. It is unclear if the 56 m flocculator achieved its minimum residual turbidity faster than the 2796cm flocculator since it is bounded on both sides by a 28 m replicate (Fig. 8). Further data is needed to draw conclusions regarding how flocculator length impacts residual turbidity with 500 NTU water.
The following results are from the experiments conducted with varying influent turbidity and flocculator length.
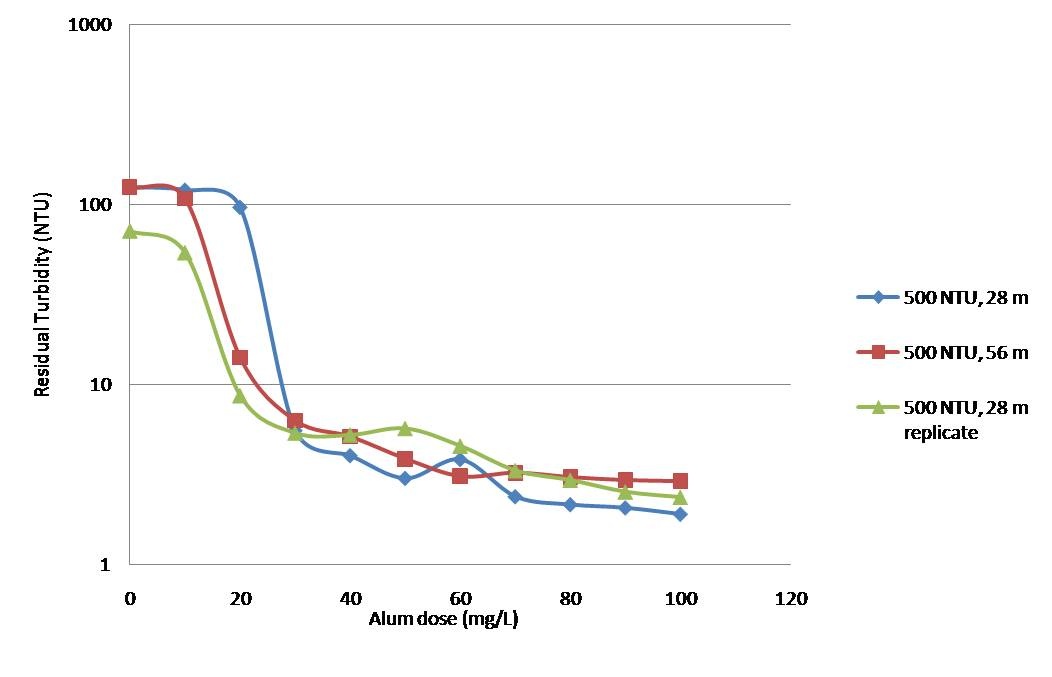
Figure 8: Comparison of residual turbidity vs. alum dose for two different flocculator lengths of 2796cm and 5592cm with influent water at 500 NTU.
Mean sedimentation velocities
Mean sedimentation velocities have a different evolution when increasing alum dose depending on the influent turbidity of the raw water (100 NTU and 500 NTU in the case of the experiments).
For a 100 NTU influent water, (figure 9 ), at a low alum dose, the mean sedimentation velocities of the flocs increase up to a maximum. Further increase in alum dose shows a decrease in the mean sedimentation velocity of the flocs. This could be explained by the fact that alum is less dense than clay. At low alum dose, alum precipitation allows the clay particles to stick to each other and to grow larger but the majority of the floc is clay. After a certain alum dose, the hypothesis is that flocs grow so big that they are vulnerable to shear stress and break up in the flocculator and then reflocculate. Equilibrium is then reached between floc break up and flocculation producing a similar distribution of particles sizes when increasing alum dose. It is hypothesized that when alum dose relative to clay increases, the floc density decreases and the mean sedimentation velocity decreases.
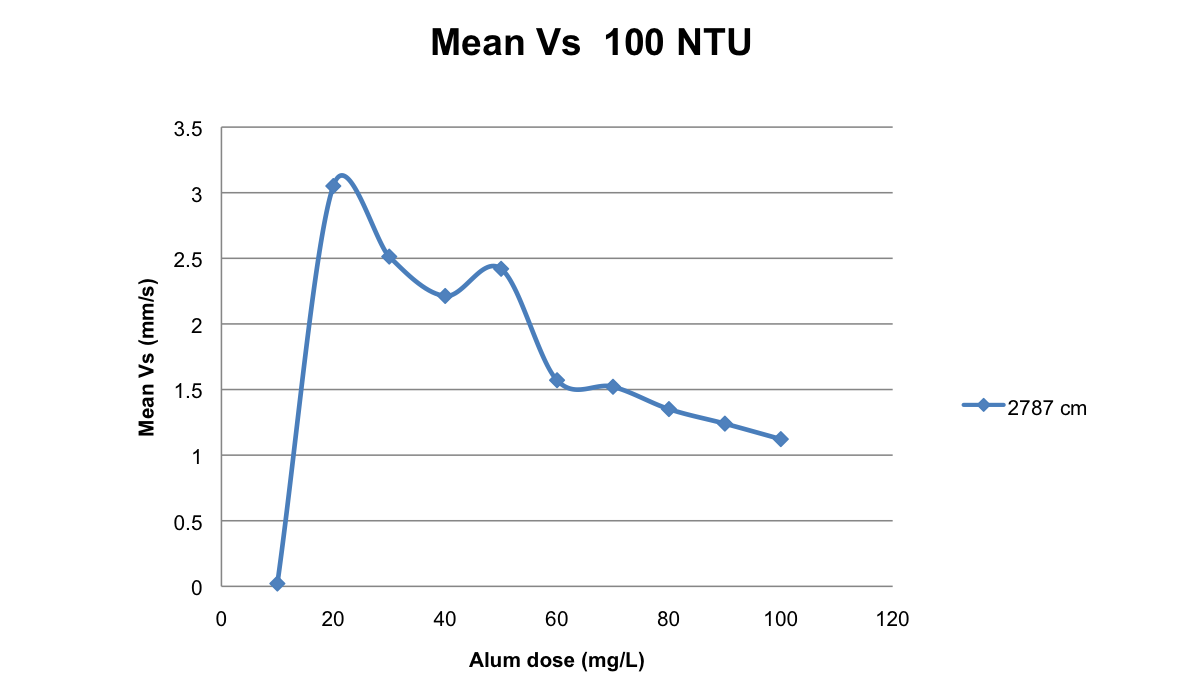
Figure 9: Plot of the mean sedimentation velocities as a function of alum dose for an effluent water of 500 NTU and a flocculator 2787 long
For an influent water of 500 NTU, the evolution of mean sedimentation velocities is different. Figure 10 below is a plot of the mean sedimentation velocity as a function of alum dose for an influent water of 500 NTU and a flocculator 2787 cm long. At low alum dose, mean sedimentation velocities increase with the alum dose. However, after a certain alum dose, mean sedimentation velocities reach a threshold. This could be explained by the fact that high turbidity water is flocculated quite quickly because the average time between two collisions of flocs is short and we hypothesize that flocs grow only to a certain point before they become too big and vulnerable to fluid shear stresses that break them. Like the 100 NTU water, after a characteristic Effect of length of the flocculator on residual turbidity:
The length of the flocculator has different effects on the residual turbidity depending on the initial effluent turbidity. In the next figures (fugures 8 and 9), we are comparing the mean residual turbidity as a function of the alum dose at 2 different lengths of flocculator, 2796 cm and 8388 cm (3*2796 cm) and for different influent turbidity, 5NTU (figure 8) and 500 NTU (figure 9) .
As shown in figure 8, at 5 NTU the length has a real effect on flocculation. Low turbidity water is more difficult to flocculate than water with high turbidity because the collision potential required to make large flocs has to be higher. There are few colloidal particles in the water so the average volume occupied by a floc or a particle is bigger so that the average time between collisions is greater leading to a higher collision potential. (Mettre la formule) With a longer flocculator, the residence time is longer and the colloidal particles have more time to collide and form big flocs with a higher terminal velocity than the one at the end of the shorter flocculator. If the terminal velocity of the flocs is bigger, it means that more flocs are going to settle and it will reduce the residual velocity. As shown on figure 8, the residual turbidity is smaller for the longer flocculator.
With an effluent water of 500 NTU, the difference between the two lengths of flocculator can't really be seen in figure 9. The mean residual turbidity is even a little bit higher with the longer flocculator at high alum dose. This could be explained by the fact that we break up flocs. A high turbidity water is easier and faster to flocculate so we are making really big flocs even with the smaller flocculator and as the flocs grow bigger and bigger, they are easier to break. The hypothesis is that a sort of equilibrium is established in the flocculator. Flocs are growing but at one point they are too big and fluid shear stresses break the flocs into smaller fragments. But then these smaller fragments can flocculate again. After some time, a steady state is reached between flocculation and fragmentation and the floc size distribution distributions stay the same. That's why the same residual turbidity is observed for the two lengths of flocculator: the steady state is reached in the two flocculators.constant. However, in the case of 500 NTU water, there is so much clay that increasing alum dose doesn't make the flocs less dense.
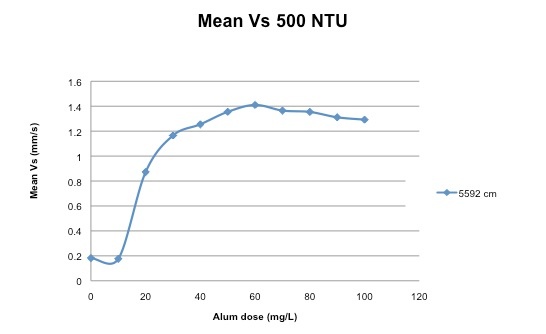
Figure 10: Plot of the mean sedimentation velocities as a function of alum dose for an effluent water of 100 NTU and a flocculator 2787 long
Mean sedimentation velocities are also influenced by the length of the flocculator. Figure 11 and 12, show mean sedimentation as a function of alum dose for three different lengths of flocculator. In figure 11, experiments were conducted with an influent water of 100 NTU and for figure 12, the experiments were conducted with an influent water of 500 NTU. On these two graphs the same trend can be observed when varying flocculator length. When the increasing flocculator length, the mean sedimentation velocities follow the same trend as alum dose increases but their corresponding magnitude decreases.
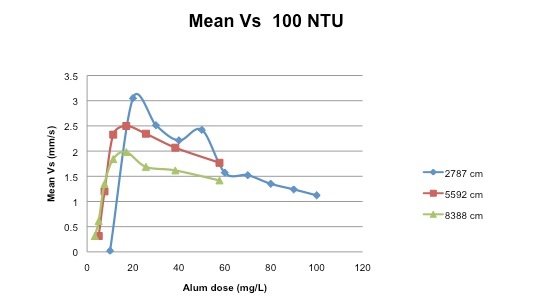
Figure 11: Plot of the mean sedimentation velocities
Figure 8: Plot of the residual turbidity as a function of alum dose for an effluent water of 100 NTU at two different length of the flocculator (2787 cm, 5592 cm, 8388 cm)
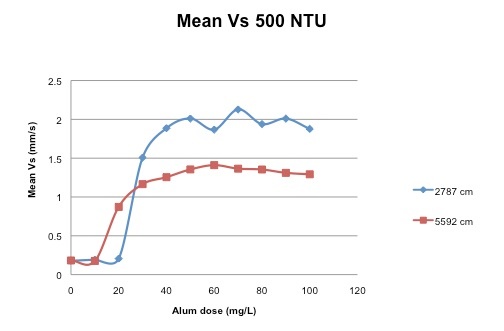
Figure 12: Plot of the mean sedimentation velocities as a function of alum dose for an effluent water of 500 NTU at different length , 796 cm and 8388 cm, for an effluent water of 5 NTU
Figure 9: of the flocculator (2787 cm, 5592 cm, 8388 cm)
A few hypotheses seem plausible explaining floc break up in the flocculator. Flocs could break up because of interactions between particles and the wall or particles and the fluid or particles and particles. Comparing mean sedimentation velocities found for an influent water of 100 NTU and 500 NTU for the same length of flocculator (figure 13), it appears that the maximum mean sedimentation velocities are lower for a 500 NTU water than for a 100 NTU water. This result seems to validate the hypothesis that floc can be broken up because of particles-particles interactions. However, further investigation should be done in order to confirm the existence of this kind of interactions.
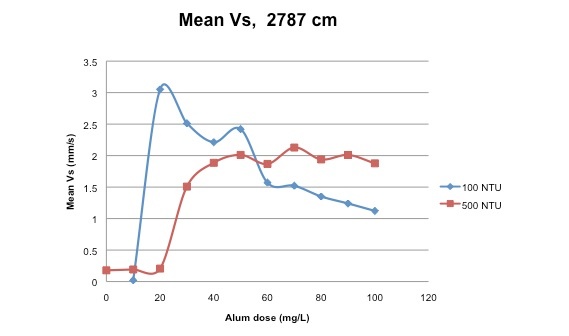
Figure 13: Plot of the mean sedimentation velocities Plot of the residual turbidity as a function of alum dose at two different flocculator length, 796 cm and 8388 cm, flocculator 2787 cm long, for an effluent influent water of 100 NTU and 500 NTU
Effect Reliability of the alum dose on flocculation:
The next figure (figure 10) we are plotting the residual turbidity data
Replicability:
Every experiment was replicated to test the reliability of the results given by FReTA. The comparison between the mean residual turbidities of the experiments and their replicates has been explained in a revious paragraph. Mean sedimentation velocities were also compared. The figure 14,15 and 16 show that our experiments were quite accurate when analyzing mean sedimentation velocities.
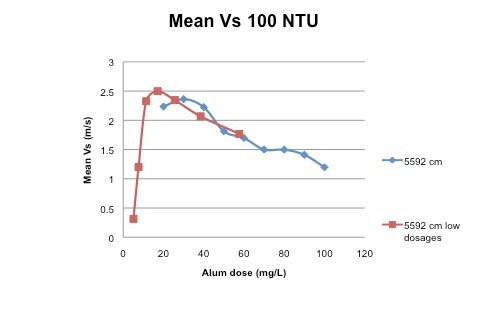
Figure 14: Plot of the mean sedimentation velocities as a function of alum dose for an effluent water of 100 NTU at the smallest length of the flocculator (2787 cm)
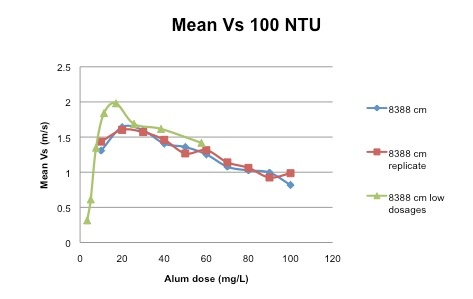
Figure 15: Plot of the mean sedimentation velocities as a function of alum dose for water with a different influent turbidity in the short flocculator (2796 cm). We can observe a similar behavior between the plots. At the beginning, the residual turbidity is decreasing when we increase alum dose and then we reach a an effluent water of 100 NTU at the medium length of the flocculator (5592 cm)
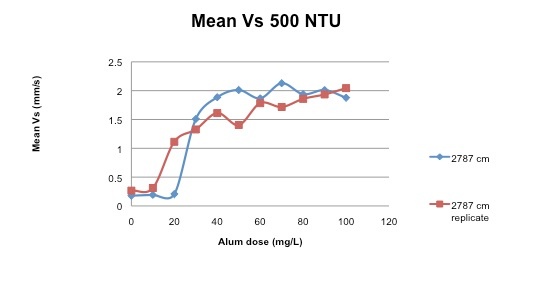
Figure 16: Plot of the mean sedimentation velocities as a function of alum dose for an effluent water of 500 NTU at the smallest length of the flocculator (2787 cm)
Mean sedimentation velocities :
The data processor retrieves mean sedimentation velocities of the particles at each alum dose during an experiment from our data. They are calculated when the data is fitted to a gamma distribution.
Since the mean sedimentation velocities are calculated when we fit the data, the mean sedimentation velocities given for a 5 NTU influent water are not accurate. Indeed, even if the data processor tries to fit the data, shape of the evolution of turbidity as a function of sedimentation velocity (figure 17) does not look like the fit function.
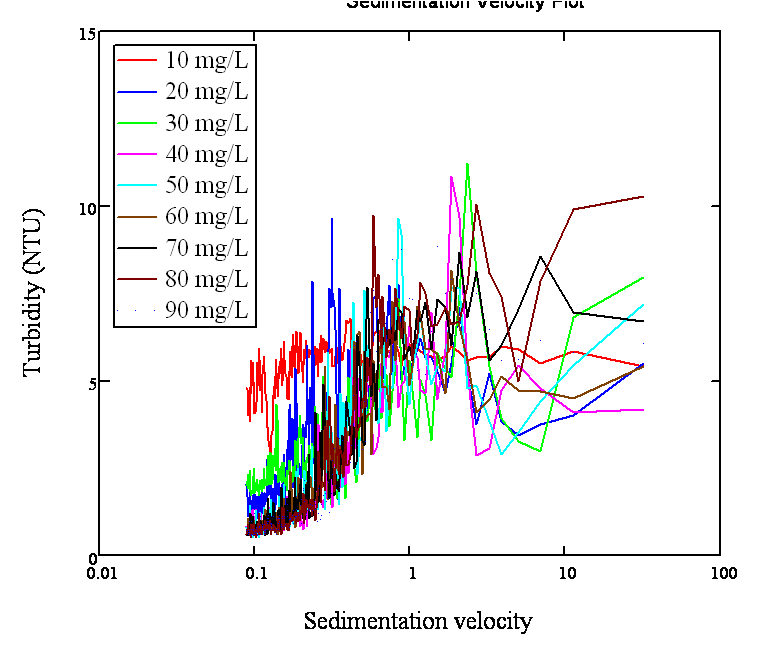
Figure 17: Plot of the turbidity vs sedimentation velocity for an influent water of 5 NTU. Flocculator 2787 cm long
For 100 NTU and 500 NTU, the fitted data seem accurate enough that we can trust the mean sedimentation velocities or the coefficient of variation retrieved. Data retrieved at low alum dosage seems to be really well fitted (figure 18). However, at higher alum concentrations, at some points, raw data seems to have a behavior slightly different than the gamma function (figure 19,20 and 21)
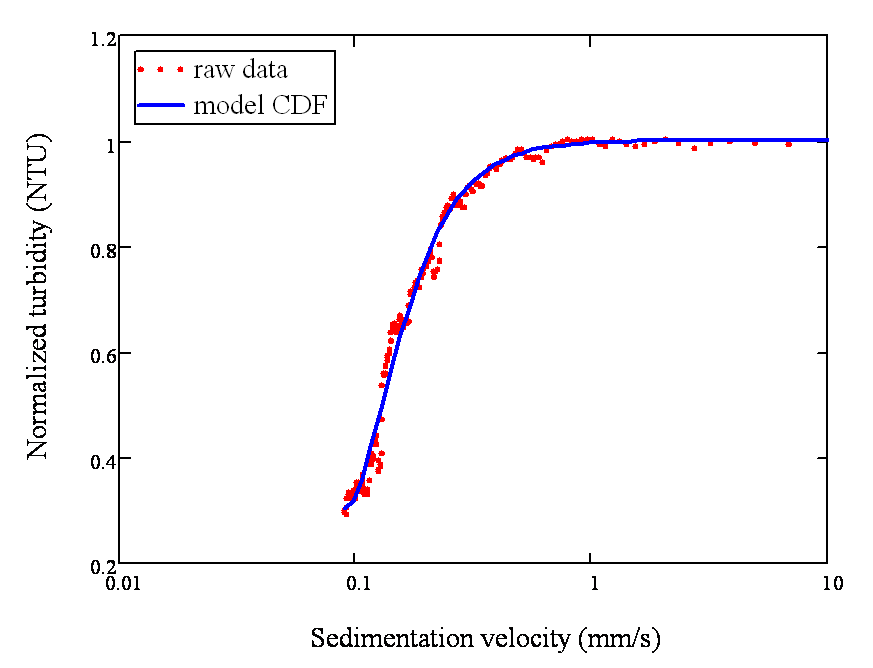
Figure 18: Plot of the normalized turbidity as a function of sedimentation velocity for the ram data and the fitted data. 500 NTU water, alum dose of 10 mg/L, flocculator 5592 cm long
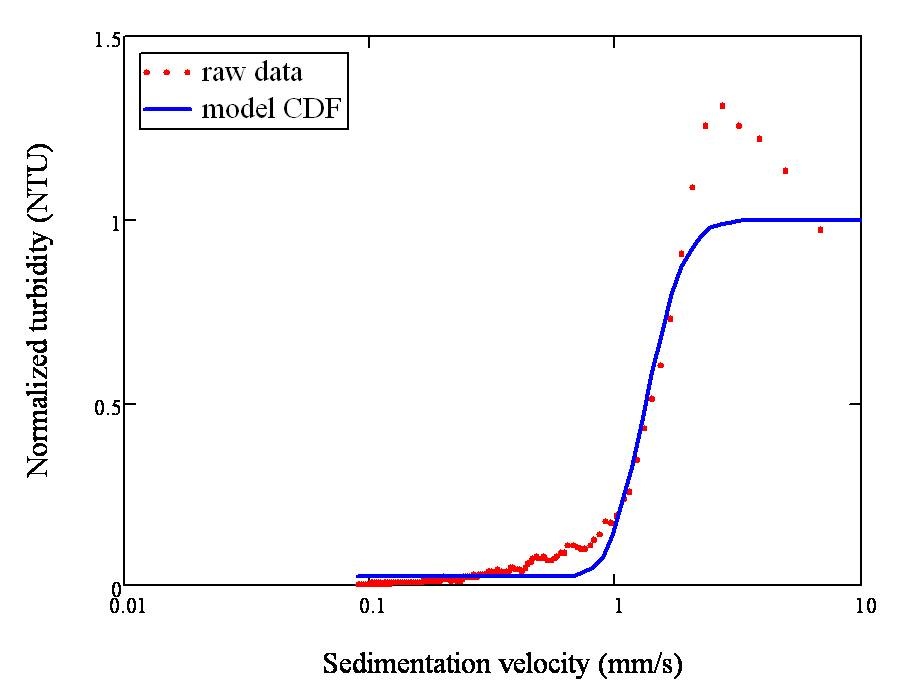
Figure 19*: Plot of the normalized turbidity as a function of sedimentation velocity for the ram data and the fitted data. 500 NTU water, alum dose of 50 mg/L, flocculator 5592 cm long
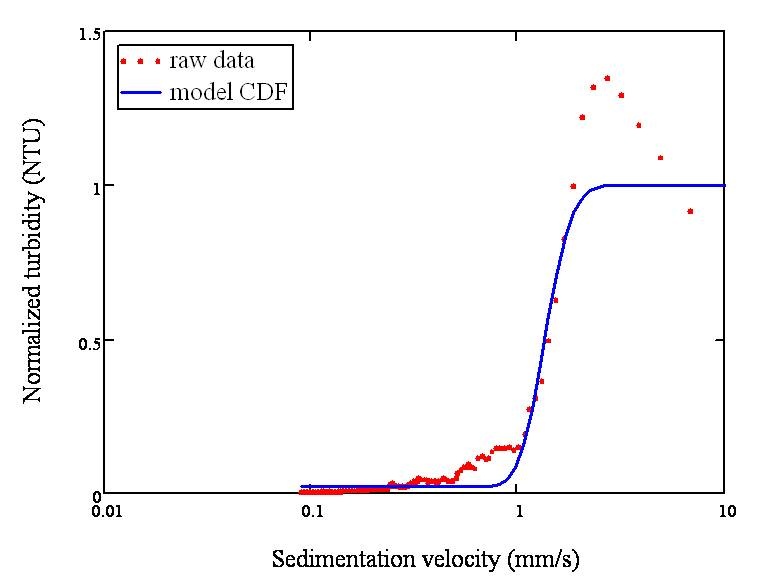
Figure 20*: Plot of the normalized turbidity as a function of sedimentation velocity for the ram data and the fitted data. 500 NTU water, alum dose of 70 mg/L, flocculator 5592 cm long
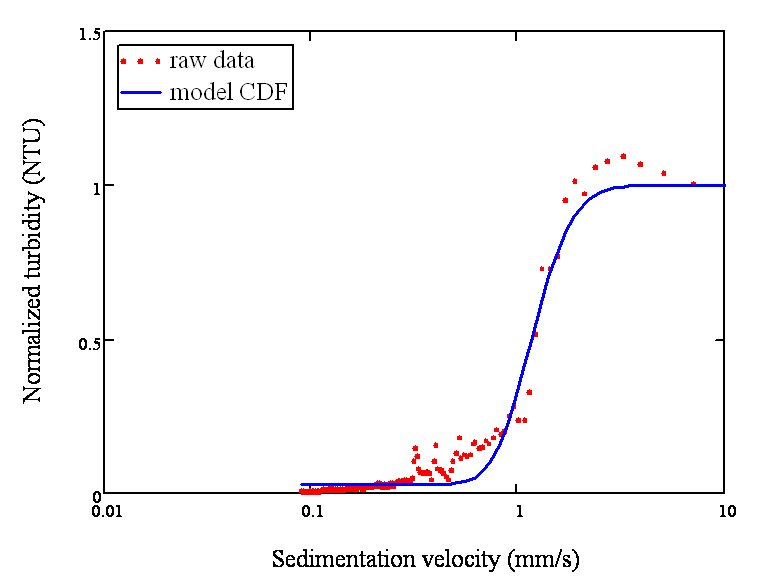
Figure 21*: Plot of the normalized turbidity as a function of sedimentation velocity for the ram data and the fitted data. 100 NTU water, alum dose of 100 mg/L, flocculator 5592 cm long limit where the residual turbidity is almost constant when we increase alum dose. These results mean that we could optimize the cost by using the minimum alum dose that gives the minimum effluent turbidity.
We can also observe on this figure that at a given alum dose, the mean residual turbidity is different for each influent turbidity. The highest residual turbidity is found for 500 NTU then 25 NTU and 5 NTU. The lowest residual turbidity is found for an influent water of 100 NTU. This could be explained by the fact that two phenomena are happening at the same time. For the low turbidity, 5 NTU and 25 NTU, as I explained earlier, it is longer to produce large flocs and the residence time in the 2796 cm long flocculator might be too short so the residual turbidity is relatively high. For the high influent turbidity, 500 NTU, we reach a steady state in the flocculator but as we are starting with a really high turbidity, the residual turbidity is high too. Logically, the optimum result should be found for a medium influent turbidity and it is found for 100 NTU.
Figure 10:Plot of the residual turbidity as a function of alum dose at different influent turbidity with a 2796 cm long flocculator