*** This version of Confluence is for testing only and contains a copy of content from June 29th 2026. No changes will be preserved. ***

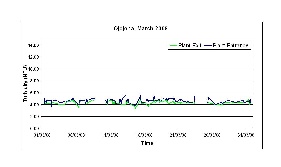
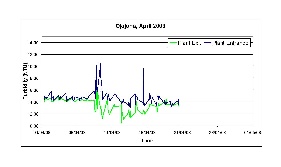
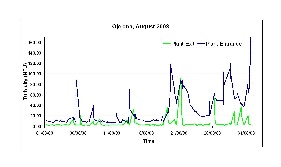
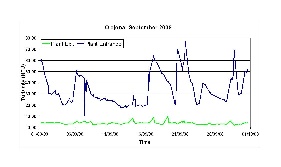
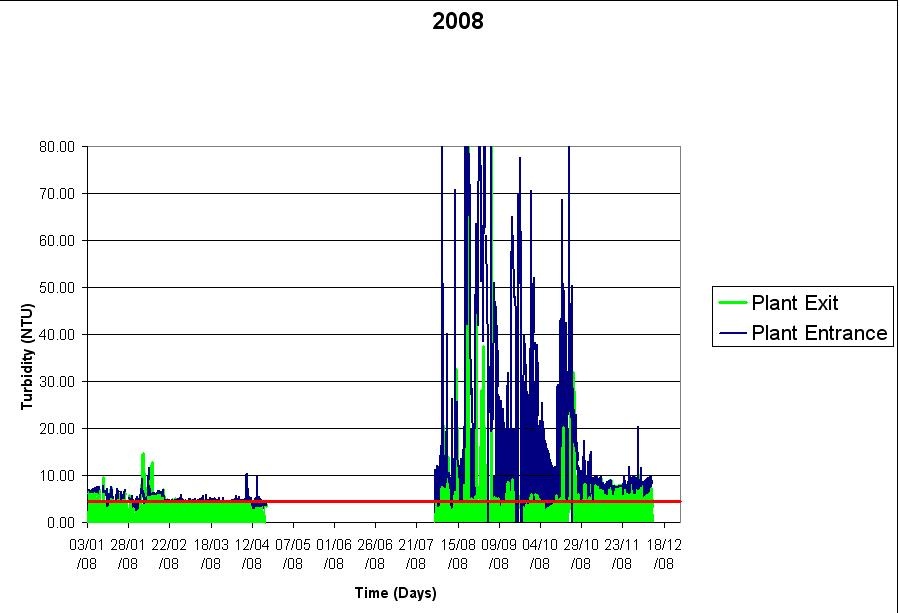
The graphs below are of turbidity data taken by the local plant operators. The operators work full-time at the plant and measure the turbdidity turbidity of the water entering and leaving the plant several times a day using an HF Scientific MicroTPW turbidimeter.
...
March
April
August
September
Total 2008 Data
These spreadsheets include turbidity records found in the graphs above, as well as the plant flowrate, aluminum sulfate dose and chlorine dose.
OjojonaData2007.xls
OjojonaData2008.xls