 Sign-up for free online course on ANSYS simulations!
| Include Page |
|---|
...
|
...
|
...
| Include Page | ||||
|---|---|---|---|---|
|
Verification & Validation
Verification
One of the ways we can verify our data is by refining the mesh. Open up the mesh, and increase the Number of Divisions for Edge Sizing and Edge Sizing 2 to 100. Click Mesh in the Outline window, and in the Details window, expand statistics. The number of elements should now be 40000.
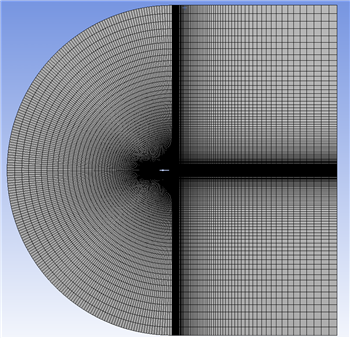
Exit out of the mesher. First, right click Setup and select Reset. Then click  in the project schematic. Open up the solver, and solve the simulation using the same solver and boundary conditions (you'll have to input them again), but this time change the number of iterations to
 5000. Again, calculate the force coefficients and graph the pressure coefficient.
Validation
To validate our data, we can compare values to actual experiment. The drag coefficient coming from our inviscid model, however, cannot be compared to actual data. The drag coefficient in our model is theoretically zero.
| Unrefined Mesh | Refined Mesh | Experimental Data |
|---|---|---|---|
Lift Coefficient | 0.6315 | 0.6670 | 0.6630 |
Drag Coefficient | 0.0122 | 0.0063 | n/a |
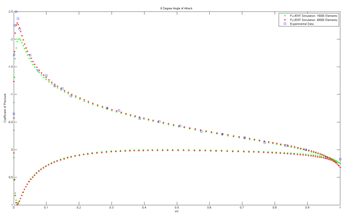
Below is a graph displaying the comparing Coefficient of Pressure along the airfoil for the experimental data and the CFD simulation. The data is from Gregory & O'Reilly, NASA R&M 3726, Jan 1970.
Click here to see an enlarged image
As we can see from the table and the graph, the CFD matches the data fairly well. There are inaccuracies from factors such as our assumption that the flow is inviscid, but we still managed to extract some meaningful information from the simulation. Click here to go to an exercise which demonstrates a more thorough approach to modeling this flow problem, which involves turning on the turbulence model equations and using a more refined mesh provided by NASA.
Go to Exercises
| Note |
|---|
This page is under construction. Check back for updates |
There are two main ways we can compare our data from the simulation. We can refine the mesh to compare the results from a courser mesh and a finer mesh to see if the results are comparable, or we can compare the results to real world date to see if they match.