*** This version of Confluence is for testing only and contains a copy of content from June 29th 2026. No changes will be preserved. ***

After testing the filtering capacity of the 60 ppi foam, 90 ppi foam was tested in hopes of achieving a greater filtering capacity. Instead of higher filtration performance. Smaller pore size would improve performance but increase headloss, as does finer sand grains. Rather than testing the foam at constant flow rates, as done previously, a ramp state was employed. Over the course of a 24 hour period, the flow rate through the foam sheet was gradually increased from 50 m/day to 250 m/day. This enables us to see whether or not a change in flow rate will effect .57 mm/s to 2.89 mm/s. This variation of flow rates will indicate whether the filtering capacity of the foam .
Figure 1 shows the raw water and effluent turbidity plotted as a function of flow rate (m/day). Before both the effluent turbidity and the raw water turbidity decrease at about 130 m/day it appears as though the effluent turbidity remains constant, regardless of flow rate.
is affected by flow rate or not. As with the tests conducted on the 60 ppi foam, raw water of 5 NTU without alum dosage was used. 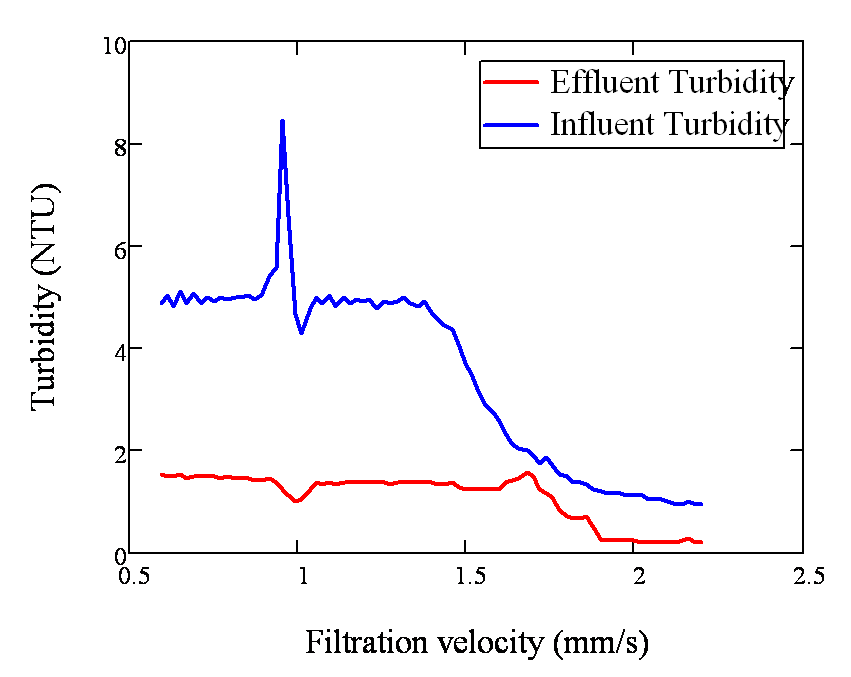
_Figure 1: Raw Water and Effluent Turbidity vs Flow RateAt about 130 m/day the . Flow_
A few things to note about Figure 1:
...
...
...
...
...
...
...
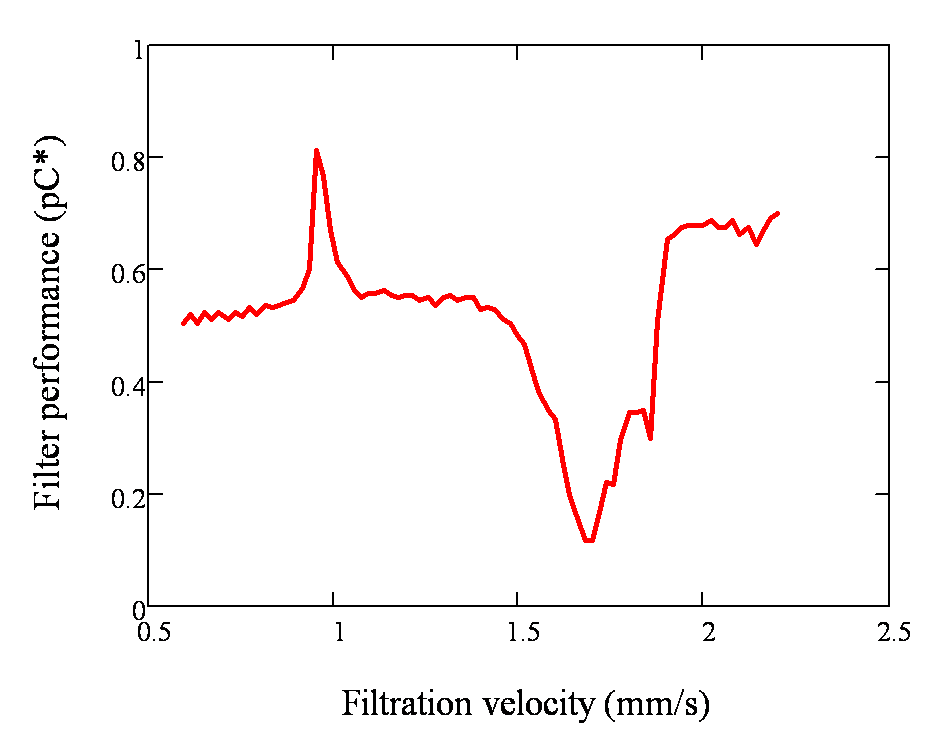
Figure 2: PC* vs Flow RateThese experimental results were analyzed using our data processor.