*** This version of Confluence is for testing only and contains a copy of content from June 29th 2026. No changes will be preserved. ***

...
Figure 1: The figure is a graphical representation of the price of PVC pipe as a function of pipe diameter.
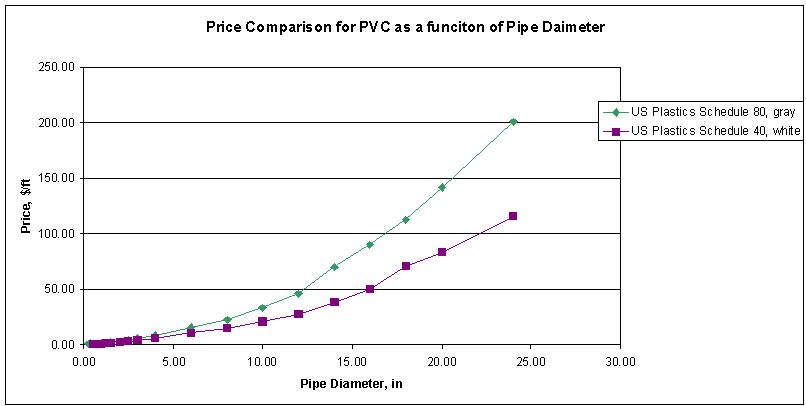
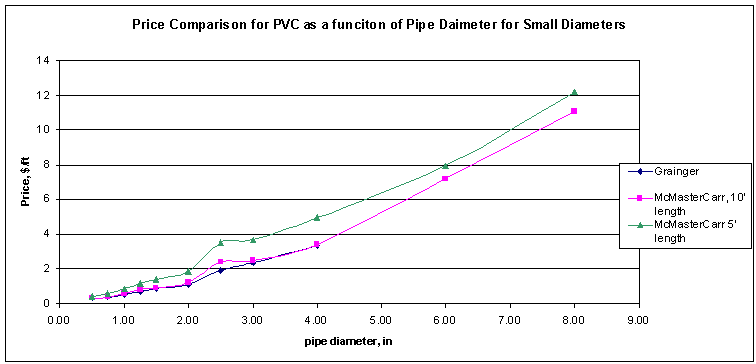
Figure 2: The figure is a graphical representation of the price of PVC pipe as a function of pipe diameter and in this case the small diameters are highlighted.
The excel spreadsheet with the primary data is available here
The results provide the background information to make an educated decision on the maximum allowable pipe diameter for the linear orifice flow meter according to price pressures. Currently I am unsure of the budget for the LFOM, with that information specification is possible.