*** This version of Confluence is for testing only and contains a copy of content from June 29th 2026. No changes will be preserved. ***

On November 12, 2009 (Do not date the experiments on the wiki, unless you have no other way of keeping track), an experiment was conducted with the turbidity set around 5 NTU, flocculator length of 2796 cm, flow rate of 5 mL/s, and alum dosage ranged from 10 to 50 mg/L.
The data processor fails failed to fit a curve into on the gamma PDF graph due to the lack of efficient flocculation (I'm not sure what you mean by efficient flocculation) and trend/difference among the turbidity produced by the varying alum doses (I don't know if you can say that these were the causes. It has to do that the using our turbidity data Thus, the turbidity data did not fit the statistical distribution function (a gamma pdf) that we are using. It may be that these are causes of this not fitting, but I am not sure.)
We speculate failure of the data to fit because Because the experiment was conducted with such a low influent turbidity, there are less colloidal particles present in the water and less probability for these particles to collide with one another. Hence, for this experiment,the shortness of the flocculator and the limited effect of the alum caused the failure of producing a significant improvement in the turbidity of the water. There will need to be a higher collision potential for these particles to successfully collide and create bigger flocs necessary for a successful flocculation. The residual turbidity graph (Figure 1) shows the resulting mean turbidity settling down to around 2 NTU starting from the alum dose of 20 mg/L. (I see what you are trying to say. Condense this section about why you fail to fit the gamma function and then speculate the cause. We cannot say for certain.)
1
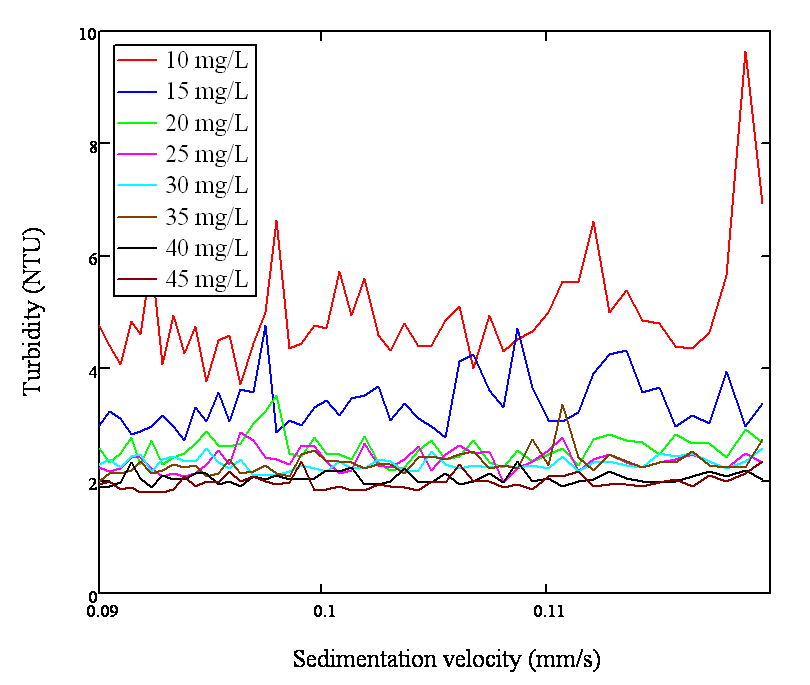
FIGURE 1: The graph plots the residual turbidity vs. sedimentation velocity for each Alum dose ranging 10 mg/L~50 mg/L
On November 17, 2009, an experiment was conducted with the turbidity set around 5 NTU, flocculator length of 8800 cm, flow rate of 5 mL/s, and alum dosage ranged from 10 to 50 mg/L.
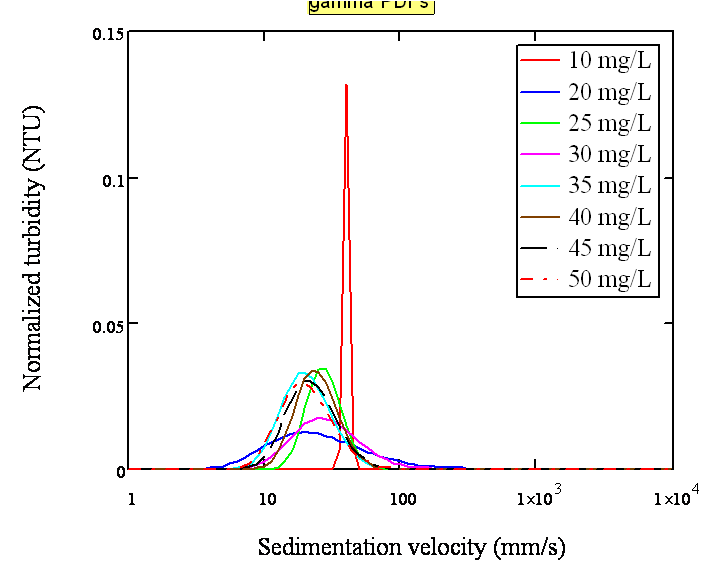
Looking at the gamma PDF curve (Figure 2A) the alum dosage of 10 mg/L demonstrates an unusual behavior compared to the other doses(I suspect ; it has a very narrow distribution focused at a particular sedimentation velocity. It is suspected that the statistical functions you we used to fit the data, did not fit the data right. 10 mg/L had a high residual turbidity and thus we should have a large portion of particle sizes in the lower sedimentation velocities. Either Also, it could possibly be the case that this resulted from an unexpected presence of a large floc that might not have been representative of 10mg/L dosage but rather at the time the process controller recorded that reading a large floc happened to intersect. An option would be to either re-run the experiment or we should accept that we cannot fit it to the data. Otherwise 20 and 30 mg/L follow the trend well) ; it has a very narrow distribution focused at a particular sedimentation velocity. We suspect that this has been resulted from an unexpected presence of a large floc that has not necessarily been produced from the flocculator (Then where was it produced?). From the residual turbidity graph (Figure 2B), there is also an unusual trend with the alum dose 40 mg/L; its turbidity unexpectedly peaks and results in an unusually high mean turbidity. (Can you speculate as to why this is the case?) In figure 2A, the alum doses 20 and 30 mg/L have wider distributions of floc sizes compared to those of other alum doses. (Comment on why they have wider distributions. Can you comment on the average particle size? Are they higher or lower) dosages. The wider distributions correspond to a wider variation in mean particle size. The average particle size for the 30 mg/L are only slightly higher than all the others. for 20 mg/L it looks similar to all the others. Overall, there seems to be discrepancies between the data recorded in the two graphs. From the values of mean turbidity at settling state, from 10 to 45 mg/L the mean turbidity seemed to start at a value of .608 NTU then rise to about .725 at 25mg/L, then rises to .829 and then back down to .755 at 35 mg/L.
2A
2B
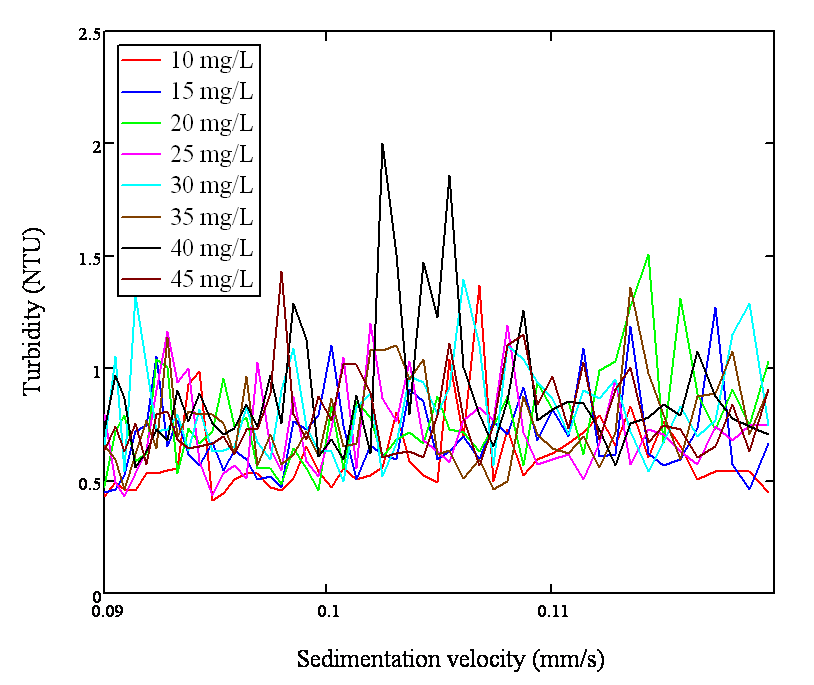
FIGURE 2A: The graph plots normalized turbidity vs. sedimentation velocity for each Alum dose ranging 10 mg/L~50 mg/L; FIGURE 2B: The graph plots the residual turbidity vs. sedimentation velocity for each Alum dose ranging 10 mg/L~50 mg/L
On November 11, 2009 (Don't date experiments), an experiment was conducted with the turbidity set around 25 NTU, flocculator length 2796 cm, flow rate of 5 mL/s, and alum dosage ranged from 10 to 50 mg/L.
In the gamma PDF graph (Figure 3A), the alum dosage 10 mg/L shows a -larger wider distribution of floc sizes with more probability to produce flocs. In addition, looking at the residual turbidity graph (Figure 3B), the resultant turbidity this dosage gives is significantly higher than the rest. The residual turbidity graph also shows the alum doses 15 mg/L and 20 mg/L to be producing a slightly higher resultant turbidity. From the values of mean turbidity at settling state, starting from the alum dosage 35 mg/L, the mean turbidity settles down to a constant value around 2.5 NTU.
(You are saying the say thing above. Lower alum dosages produce a larger range of floc sizes. Put these two figures into one or choose the ones that best represent this trend and comment on this)
3A 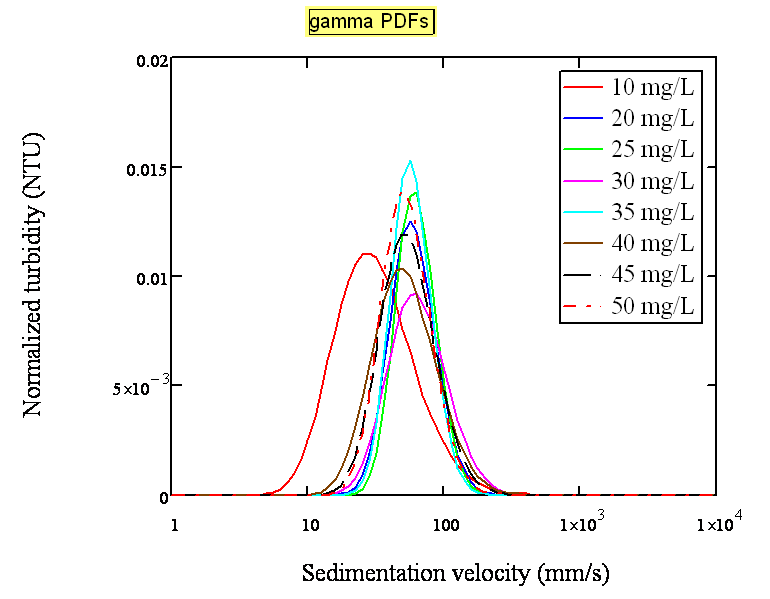
3B 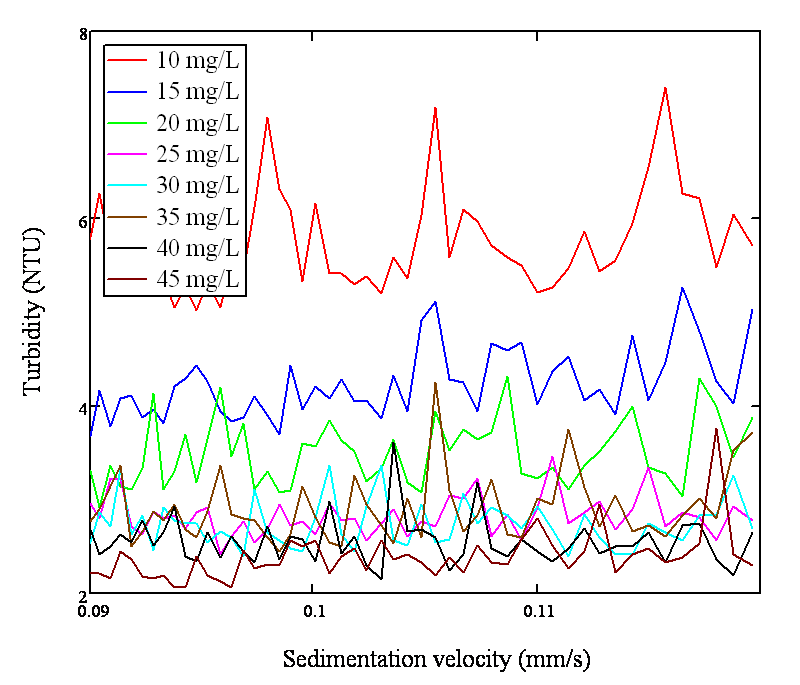
FIGURE 3A: The graph plots normalized turbidity vs. sedimentation velocity for each Alum dose ranging 10 mg/L~50 mg/L; FIGURE 3B: The graph plots the residual turbidity vs. sedimentation velocity for each Alum dose ranging 10 mg/L~50 mg/L
On October 20, 2009, an experiment was run with the set up of influent turbidity around 100 NTU, flocculator length of 2796 cm, flow rate of 5 mL/s, and an alum dosage ranging from 20 to 55 mg/L. The data obtained from this experiment was processed through Mathcad for a simplified overview of the results in graphic form.
Looking at (Do not write informally in technical writing) The gamma PDF graph (Figure 4A) illustrates that the alum dosage of 20 mg/L gives a widely distributed probability of reaching different floc sizes with a comparably low probability to reach its highest sedimentation velocity. In addition, the residual turbidity graph (Figure 4B) shows a high turbidity for this alum dose in its lower velocity range. Thus the alum dose 20 mg/L seems to be inefficient for this particular influent turbidity and flow rate. The mean turbidity resulting from alum dose 55 mg/L is out of normal range; its NTU value is significantly lower than the values given from the previous, lower alum dosages. Hence, the result from this dosage is doubtful. Overall, after the alum dose of 35 mg/L (except for 55 mg/L), the mean turbidity settles down to a constant value around 1.4 NTU. (You are saying the same thing here. Can you instead create a graph that shows the average particle size at different alum dosages and turbidities (with relative standard deviation error bars) ?)
4A 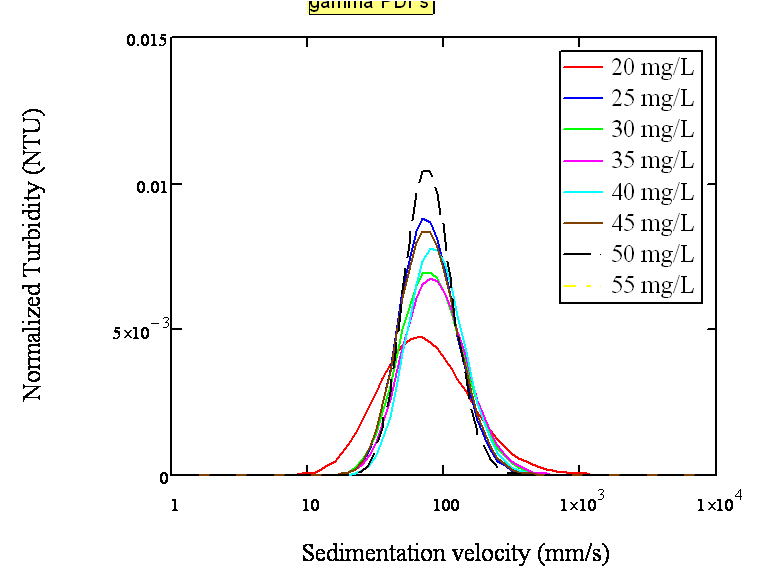
4B 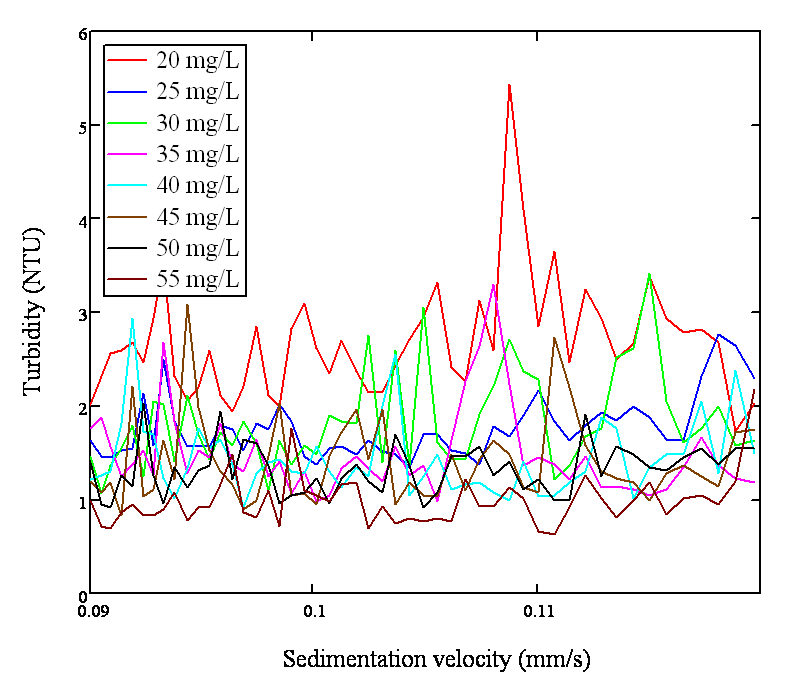
FIGURE 4A: The graph plots normalized turbidity vs. sedimentation velocity for each Alum dose ranging 20 mg/L~55 mg/L; FIGURE 4B: The graph plots the residual turbidity vs. sedimentation velocity for each Alum dose ranging 20 mg/L~55 mg/L
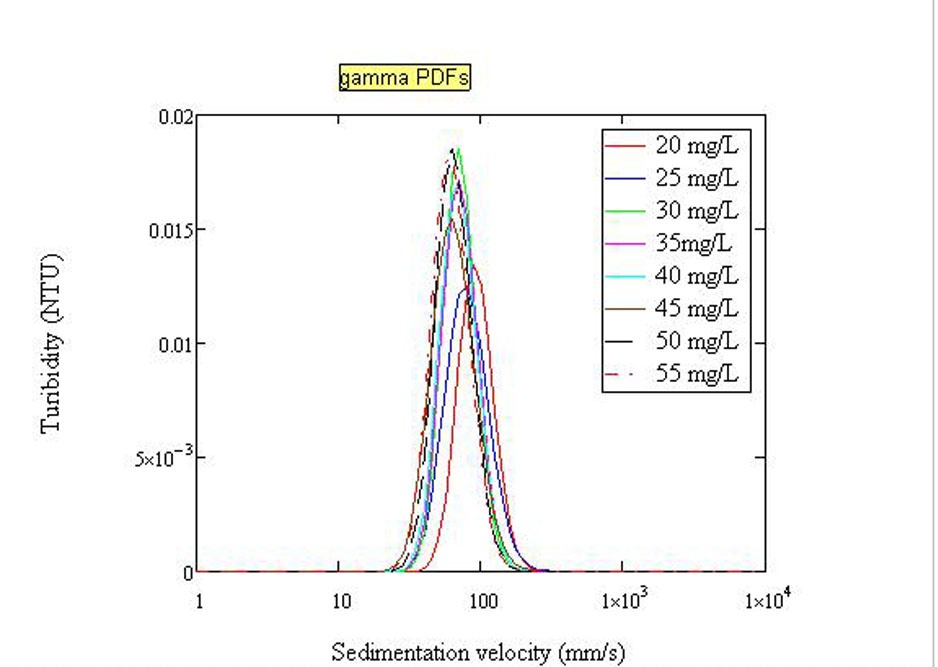
On November 18, 2009, an experiment was ran with the set up of influent turbidity around 100 NTU, flocculator length of 8800 cm, flow rate of 5 mL/s, and an alum dosage ranging from 20 to 55 mg/L.
...
5A
5B
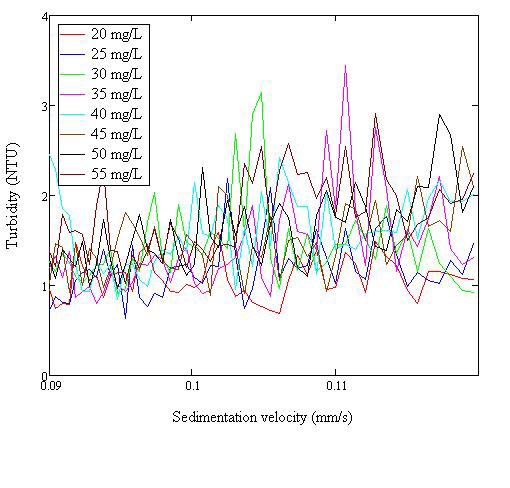
FIGURE 5A: The graph plots normalized turbidity vs. sedimentation velocity for each Alum dose ranging 20 mg/L~55 mg/L; FIGURE 5B: The graph plots the residual turbidity vs. sedimentation velocity for each Alum dose ranging 20 mg/L~55 mg/L
On Oct 27, 2009, another experiment was conducted with the turbidity set around 500 NTU, flocculator length 2796 cm, flow rate of 5 mL/s, and alum dosage ranging from 10 to 90 mg/L.
...
6A 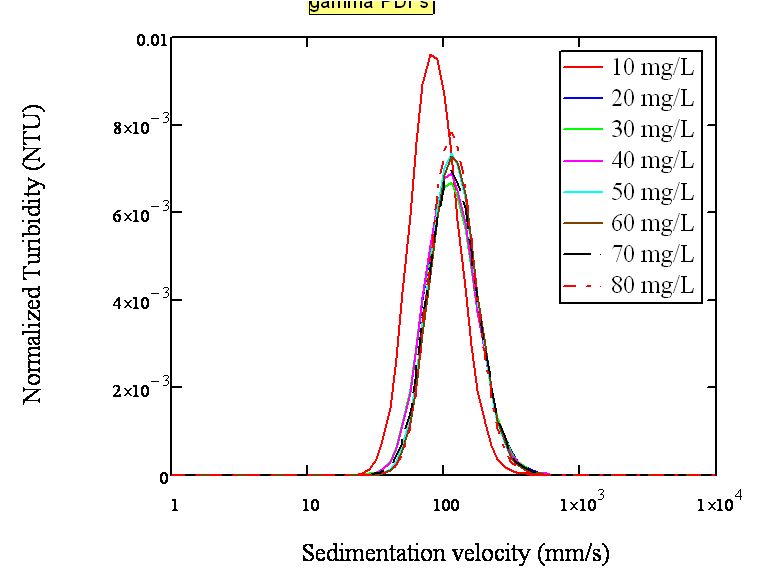
6B 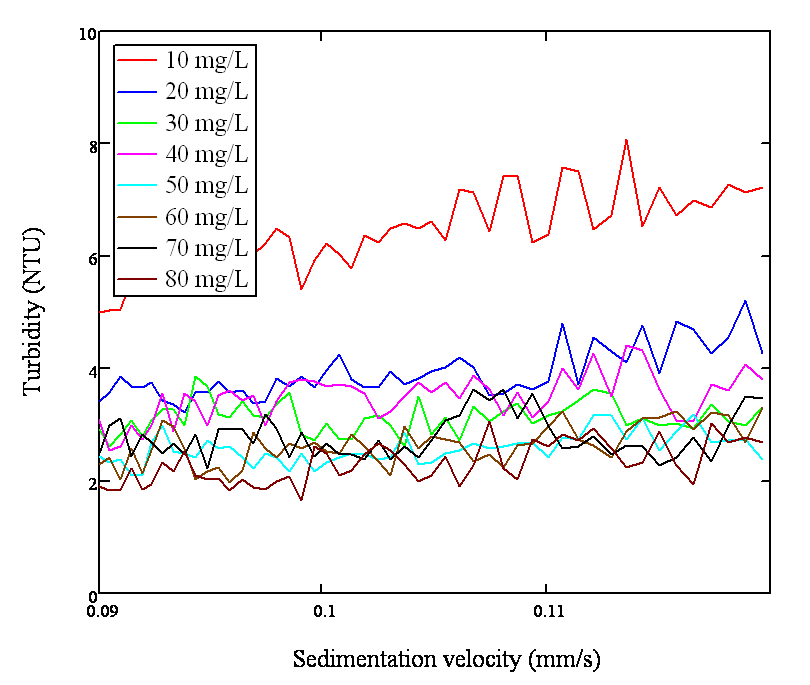
FIGURE 6A: The graph plots normalized turbidity vs. sedimentation velocity for each Alum dose ranging 10 mg/L~90 mg/L; FIGURE 6B: The graph plots the residual turbidity vs. sedimentation velocity for each Alum dose ranging 10 mg/L~90 mg/L
On Nov 19, 2009, another experiment was conducted with the turbidity set around 500 NTU, flocculator length 8388 cm, flow rate of 5 mL/s, and alum dosage ranging from 10 to 90 mg/L.
...
7A
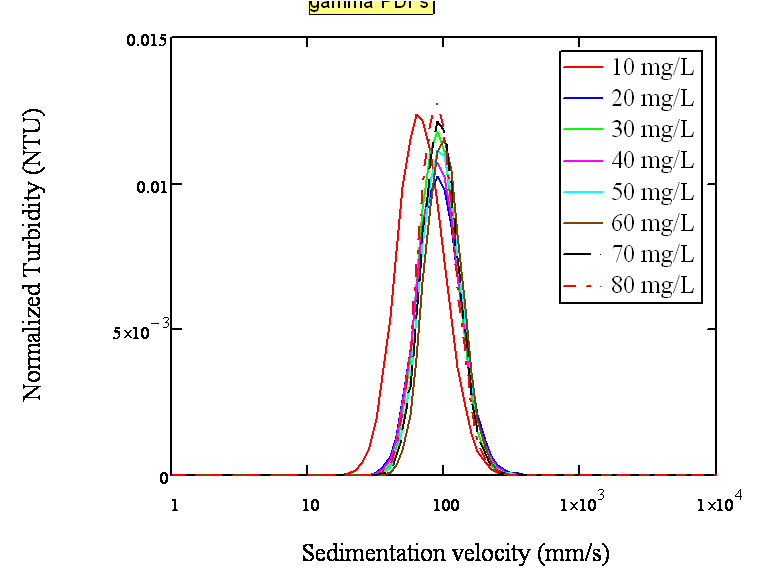
7B
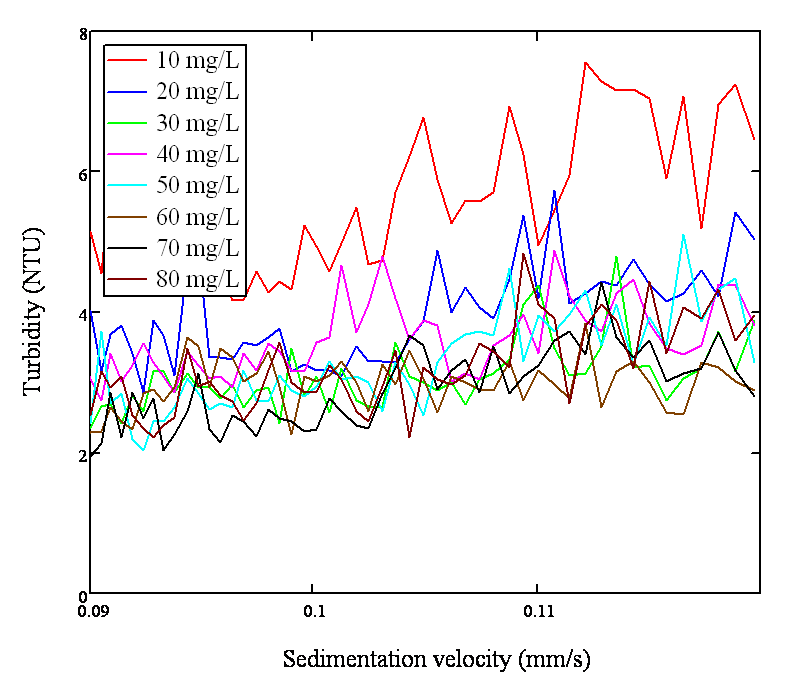
FIGURE 7A: The graph plots normalized turbidity vs. sedimentation velocity for each Alum dose ranging 10 mg/L~90 mg/L; FIGURE 7B: The graph plots the residual turbidity vs. sedimentation velocity for each Alum dose ranging 10 mg/L~90 mg/L