*** This version of Confluence is for testing only and contains a copy of content from June 29th 2026. No changes will be preserved. ***

...
Results from 5 NTU experiments:
Both of our replicates (Fig. 1) for a flocculator of 2796cm 28 m showed close agreement. Starting at a residual turbidity close to 5 NTU with an alum dose of 10mg/L, the residual turbidity dropped with increased increasing alum dose until it appears appeared to hit a limiting value of about 0.8 NTU with an alum dose of 50 mg/L. After this point, increasing alum dose no longer appears appeared to have an effect on residual turbidity. We hypothesize that initially, floc buildup is the dominiant process occurringthe flocs grow larger as alum dose is increased; the alum works as expected to cause the smaller particles to stick together and form larger flocs. However, as the flocs grow in size, shearing forces increase causing the flocs to breakup. Eventually this breakup balances the floc growth due to alumthey become larger, less dense and therefore more susceptible to breakup due to shearing forces. At a certain point. adding further coagulant can no longer hold the large flocs together, and the shearing forces cause them to begin breaking up. As a result, flocs cannot continue to grow larger, and as a consequence residual turbidity stops decreasing.
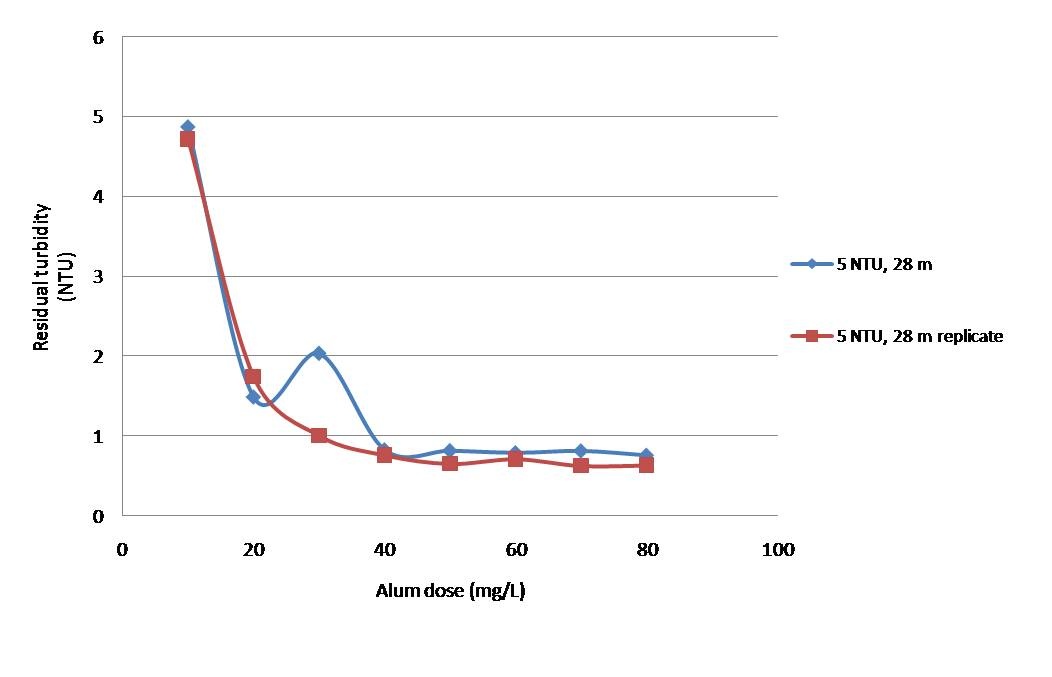
Figure 1: Residual turbidity vs. alum dose for 5 NTU influent water for a flocculator length of 2796cm.
For a flocculator length of 8388cm84 m, we focused on the lower alum dosages to see how then the residual turbidity plot developed; experiments with higher alum dosages tended to show relatively constant residual turbidities around the minimum value achieved with low dosages (Fig.2). Here we see a similar trend to what was observed at 2796 cm28 m, although the two replicates do not match as closely at the low endhave a significantly different values at lower alum dosages. We suspect this is due to limits in the calibration of the pumps, combined with the possibility of blockages in the alum line and variations in influent turbidity, making it difficult to achieve consistent results at such low alum dosages.
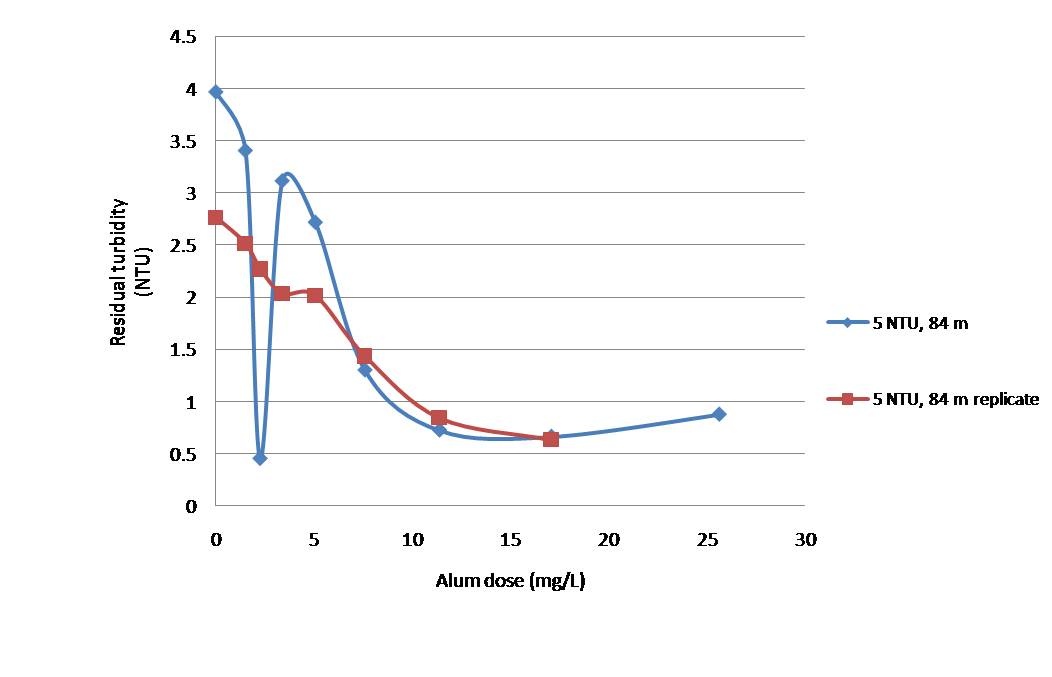
Figure 2: Residual turbidity vs. alum dose for 5 NTU influent water for a flocculator length of 8388cm, focusing on lower alum dosages.
It appears that both flocculator lengths achieve similar minimum residual turbidity values of around 0.7 NTU (Fig. 3). However, the longer flocculator is able to achieve this with much lower alum dosages than the shorter one. Since shear rate was held constant, we hypothesize that the increased residence time of the longer flocculator allowed the flocs to grow larger with less alum since they had more time to collide before reaching the settling column. Although the minimum residual turbidity was achieved with lower alum dosages in the longer flocculator, it appears that increasing the length of the flocculator did not result in a lower residual turbidity than could otherwise have been achieved with the shorter flocculator using higher alum dosages. The dose of alum required to achieve an effluent turbidty of 1 was reduced by 30 mg/L to 10 mg/L by increasing Gθ from 22951 to 68853.
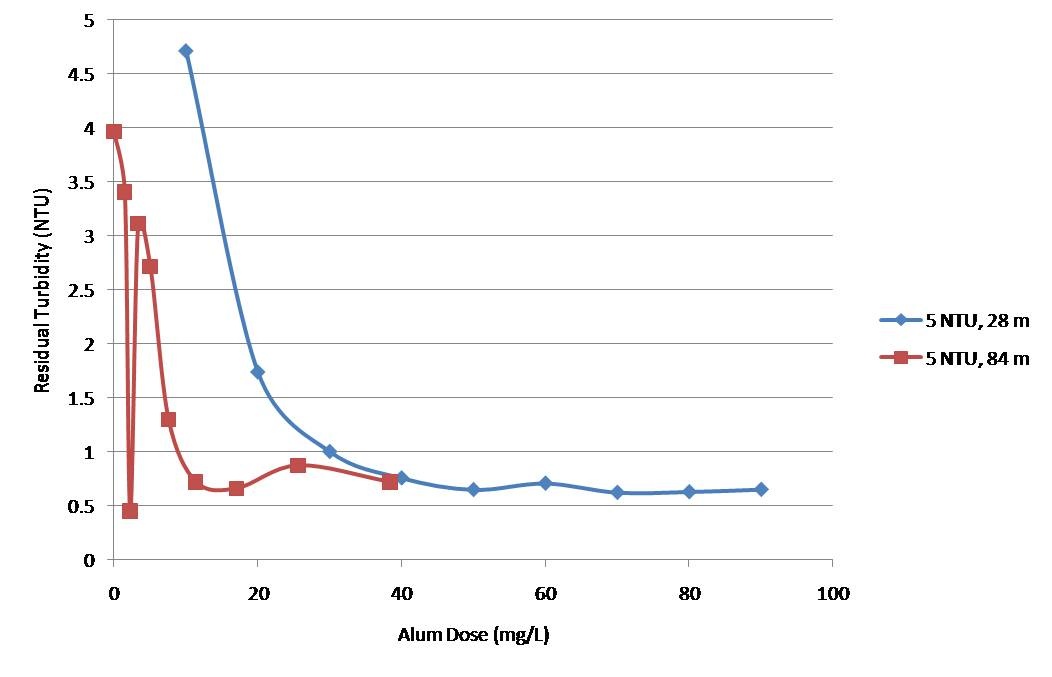
Figure 3: Comparison of residual turbidity vs. alum dose for two different flocculator lengths of 2796cm and 8388cm.
Results from 100 NTU experiments:
With 100NTU 100 NTU water and a flocculator length of 2796cm28 m, we see a similar behavior to what was observed with 5 NTU influent water (Fig. 4). The residual turbidity starts out high before approaching a minimum value. However, this minimum residual turbidity is higher than what was observed with increased from 0.6 NTU for 5 NTU water , being around to 0.9-1 NTU for 100 NTU water. This is likely due to the fact that there is about 20 times as much clay initially as the 5 NTU experiments, making it much more difficult to achieve the same minimum residual turbidities.
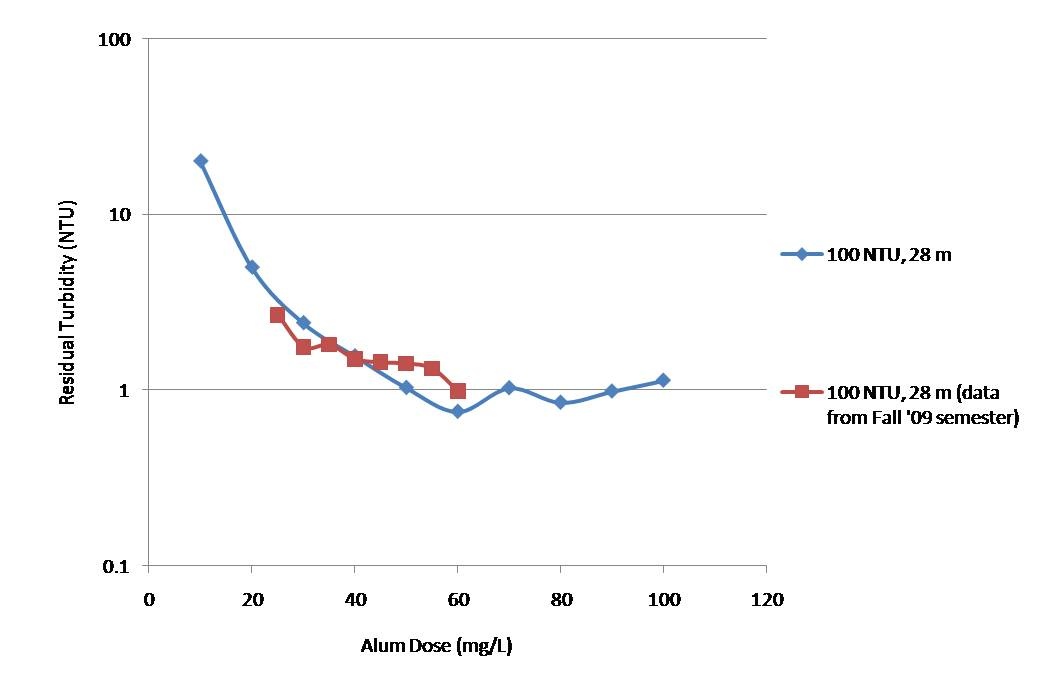
Figure 4: Residual turbidity vs. alum dose for 100 NTU influent water for a flocculator length of 2796cm. A logarithmic scale is used on the residual turbidity axis to show details of the minimum residual turbidity achieved.
Both replicates at 5592cm 56 m (Fig. 5) show the characteristic decay of residual turbidity to a limiting value. However, they do not agree at the low alum dosages; the second repliucate replicate shows a much lower residual turbidty turbidity for comparable alum doses at the low end of the curve. We suspect that there may have been a blockage in the alum line during the first experiment resulting in this irregularity. This is because alum doses as high as 20 mg/L produced a residual turbidity of around 80 NTU, much higher than would be expected. We then hypothesize that the blockage cleared by the fourth data point in the second replicate, and as a result both replicates achieved similar limiting residual turbidities of around 0.8 NTU.
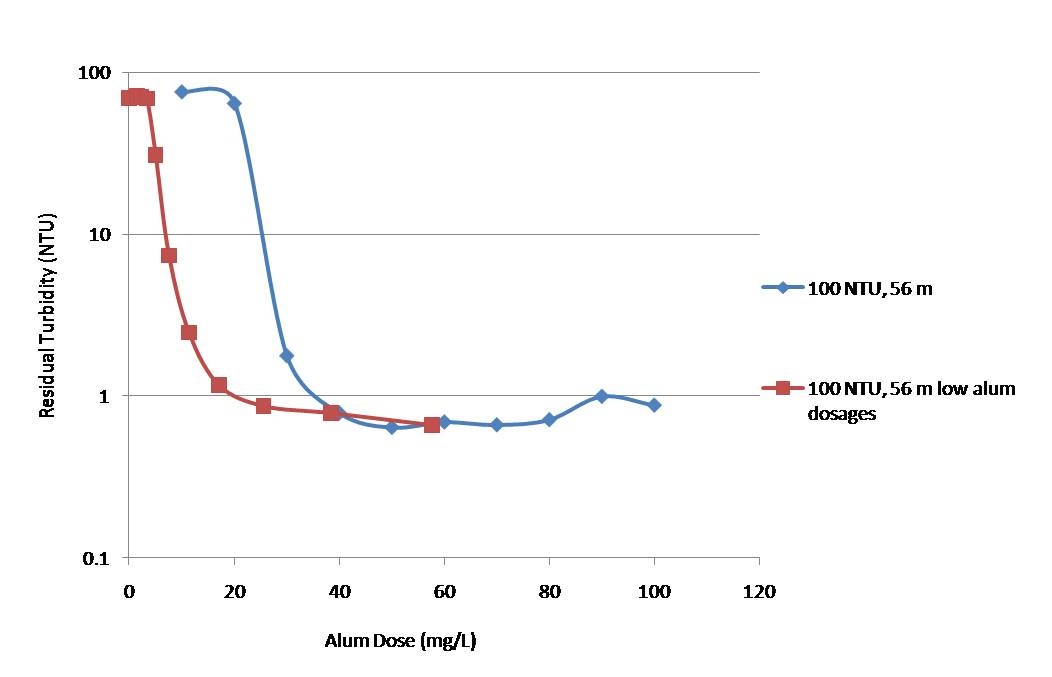
Figure 5: Residual turbidity vs. alum dose for 100 NTU influent water for a flocculator length of 5592cm. A logarithmic scale is used on the residual turbidity axis to show details of the minimum residual turbidity achieved.
The three replicates of a flocculator length of 8388 cm 84 m at 100 NTU show reasonable agreement, as well as the same characteristic decay of residual turbidity observed in previous experiments (Fig. 6). However, the minimum residual turbidity achieved averaged around 1.6-2 NTU, significantly higher than observed at the previous two lengths. It appears that for a flocculator length of 8388cm84 m, the floc breakup behavior becomes more dominant, resulting in elevated residual turbdities.
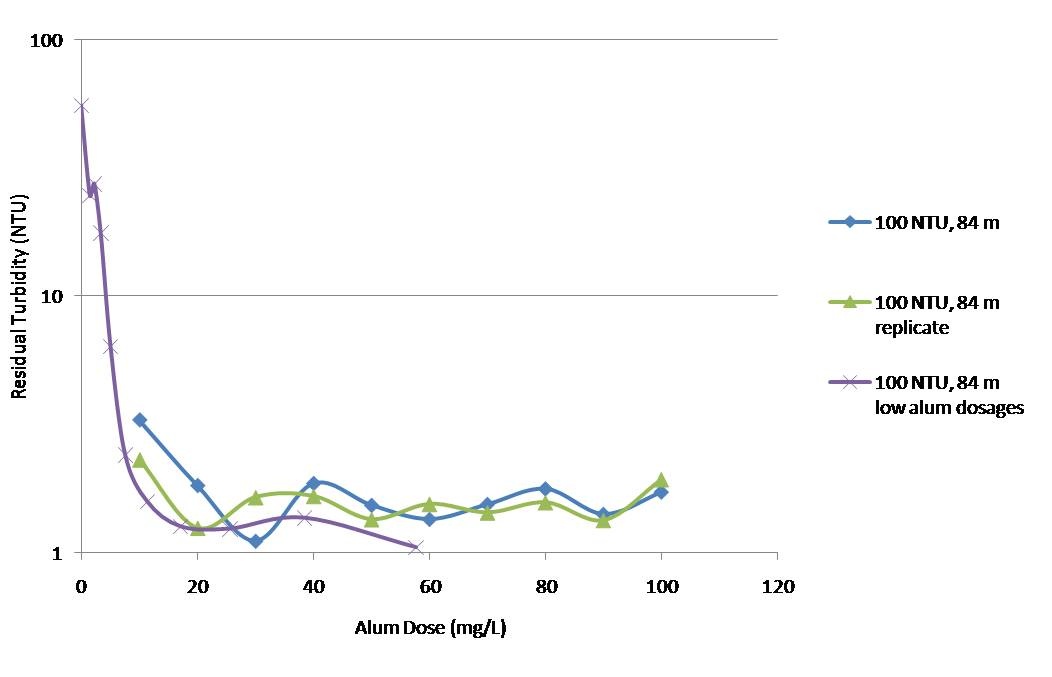
Figure 6: Residual turbidity vs. alum dose for 100 NTU influent water for a flocculator length of 5592cm. A logarithmic scale is used on the residual turbidity axis to show details of the minimum residual turbidity achieved.
Comparing characteristic replicates from each of the three flocculator lengths, the same trend as seen with 5 NTU influent water is observed (Fig. 7). The longer , as the flocculator length is increased, the a lower the alum dose is needed to achieve the minimum residual turbidity. However, when When the flocculator is increased from 2796cm 28 m to 5592cm56 m, the minimum residual turbidity decreases slightly from about 0.9 NTU to about 0.8 NTU. However, when it is further increased to 8388cm84 m, the residual turbidity jumps up to around 1.8 NTU. Therefore, it appears that while increasing flocculator length can produce favorable results as seen in the decrease in alum dose needed to achieve similar residual when comparing the two shorter lengths, further increases can be detrimental to flocculation performance. This implies that increasing flocculator length too much causes the flocs to breakup and reform smaller flocs that do not settle out as effectively.
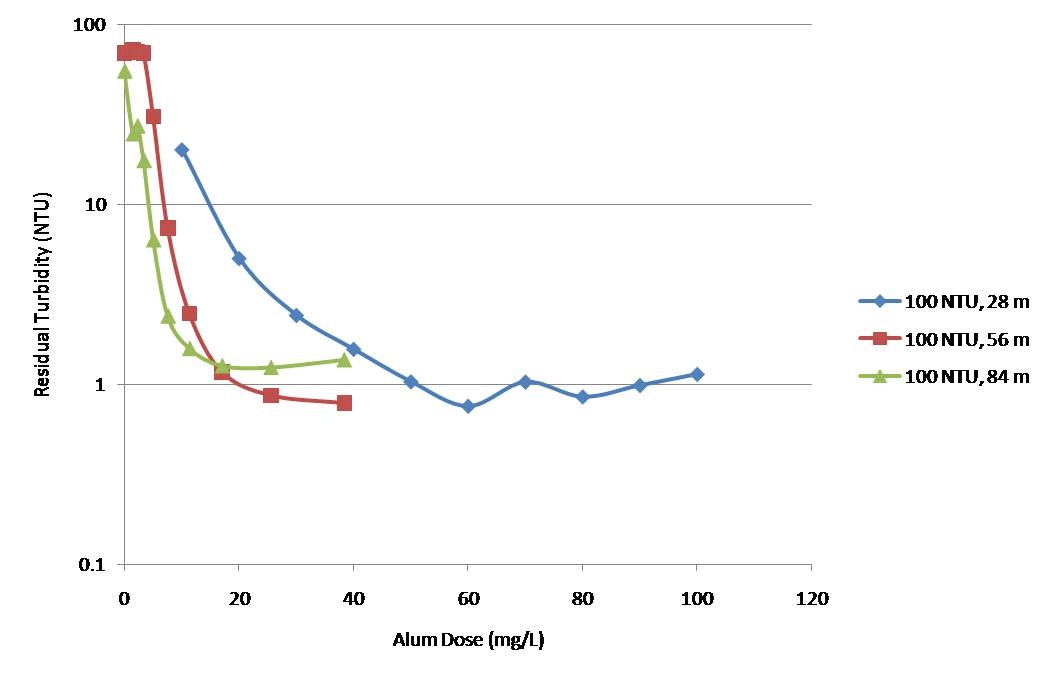
Figure 7: Comparison of residual turbidity vs. alum dose for three different flocculator lengths of 2796cm, 5592cm, and 8388cm with influent water at 100 NTU. A logarithmic scale is used on the residual turbidity axis to show details of the minimum residual turbidity achieved.
Results from 500 NTU experiments:
For the 500 NTU experiments, similar minimal residual turbidities were achieved using flocculator lengths of 2796cm 28 m and 8388cm of around 2 NTU. Additionally both showed similar behaviors to what was observed before. It is unclear if the 5592cm 56 m flocculator achieved its minimum residual turbidity faster than the 2796cm flocculator since it is bounded on both sides by a 2796cm 28 m replicate (Fig. 8). Further data is needed to draw conclusions regarding how flocculator length impacts residual turbidity with 500 NTU water.
The following results are from the experiments conducted with varying influent turbidity and flocculator length.
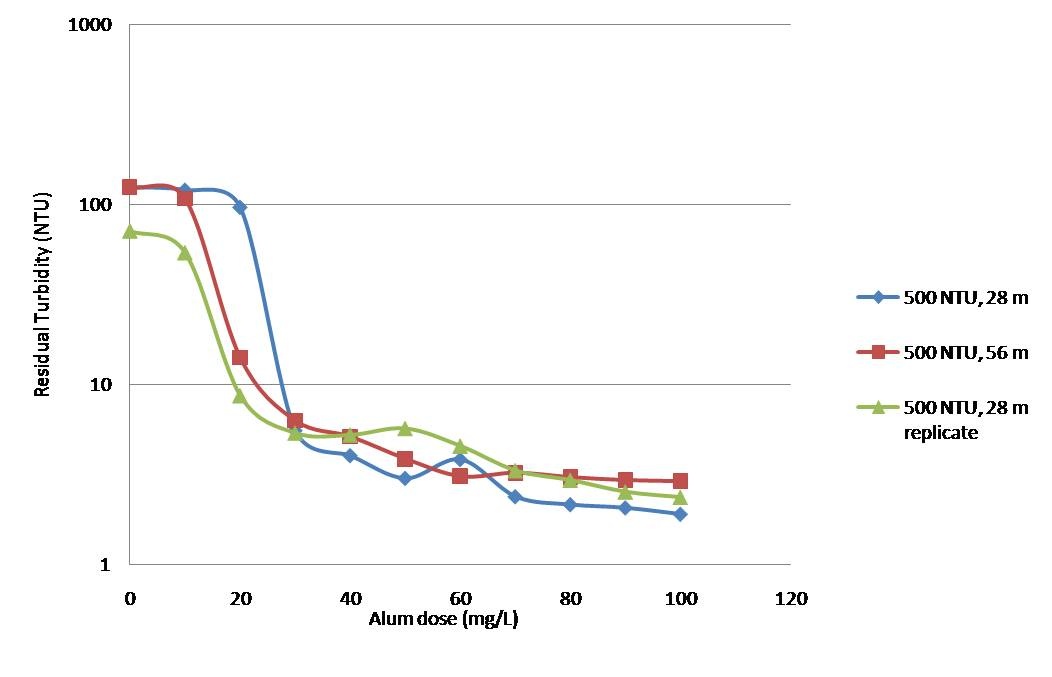
Figure 8: Comparison of residual turbidity vs. alum dose for two different flocculator lengths of 2796cm and 5592cm with influent water at 500 NTU.
...
A few hypotheses seem plausible explaining floc break up in the flocculator. Flocs could break up because of interactions between particles and the wall or particles and the fluid or particles and particles. Comparing mean sedimentation velocities found for an influent water of 100 NTU and 500 NTU for the same length of flocculator (figure ?13), it appears that the maximum mean sedimentation velocities are lower for a 500 NTU water than for a 100 NTU water. This result seems to validate the hypothesis that floc can be broken up because of particles-particles interactions. However, further investigation should be done in order to figure out what interactions confirm the existence of this kind of interactions.
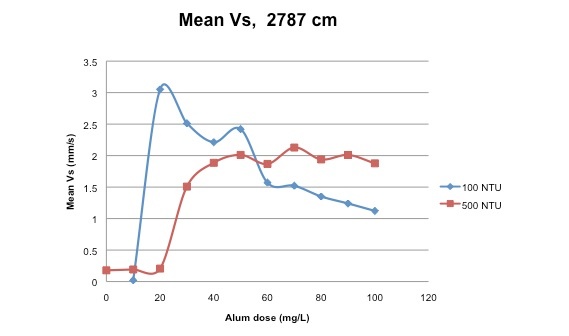
Figure 13: Plot of the mean sedimentation velocities as a function of alum dose, flocculator 2787 cm long, for an influent water of 100 NTU and 500 NTU
...
Mean sedimentation velocities :
The data processor retrieves mean sedimentation velocities of the particles at each alum dose during an experiment from our data. They are calculated when the data is fitted to a gamma distribution.
Since the mean sedimentation velocities are calculated when we fit the data, the mean sedimentation velocities given for a 5 NTU influent water are not accurate. Indeed, even if the data processor tries to fit the data, shape of the evolution of turbidity as a function of sedimentation velocity (figure 17) does not look like the fit function.
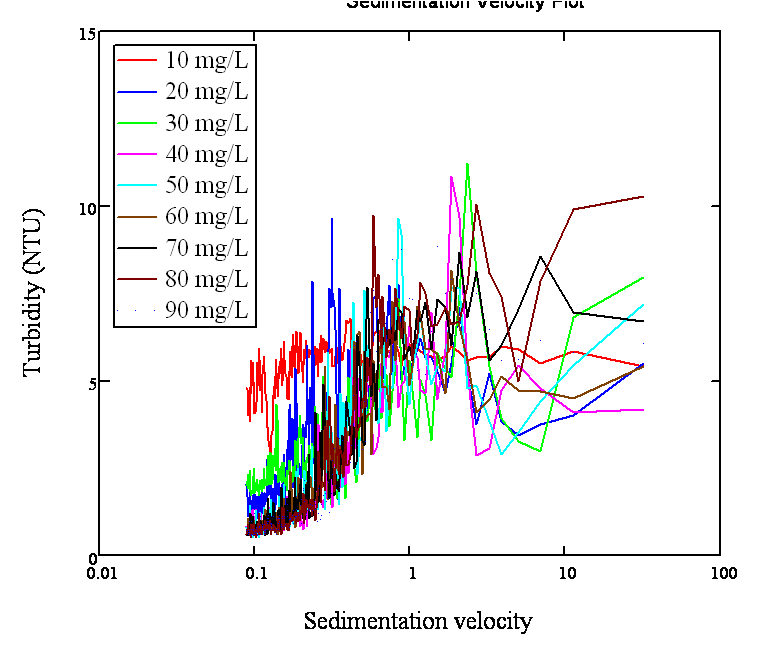
Figure 17: Plot of the turbidity vs sedimentation velocity for an influent water of 5 NTU. Flocculator 2787 cm long
For 100 NTU and 500 NTU, the fitted data seem accurate enough that we can trust the mean sedimentation velocities or the coefficient of variation retrieved. Data retrieved at low alum dosage seems to be really well fitted (figure 18). However, at higher alum concentrations, at some points, raw data seems to have a behavior slightly different than the gamma function (figure ??)19,20 and 21)
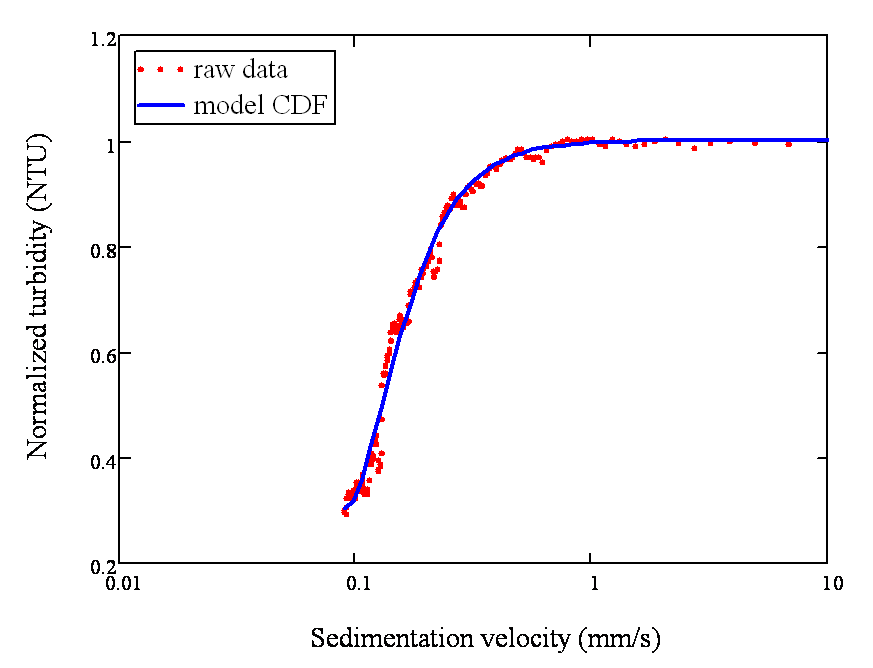
Figure 18: Plot of the normalized turbidity as a function of sedimentation velocity for the ram data and the fitted data. 500 NTU water, alum dose of 10 mg/L, flocculator 5592 cm long
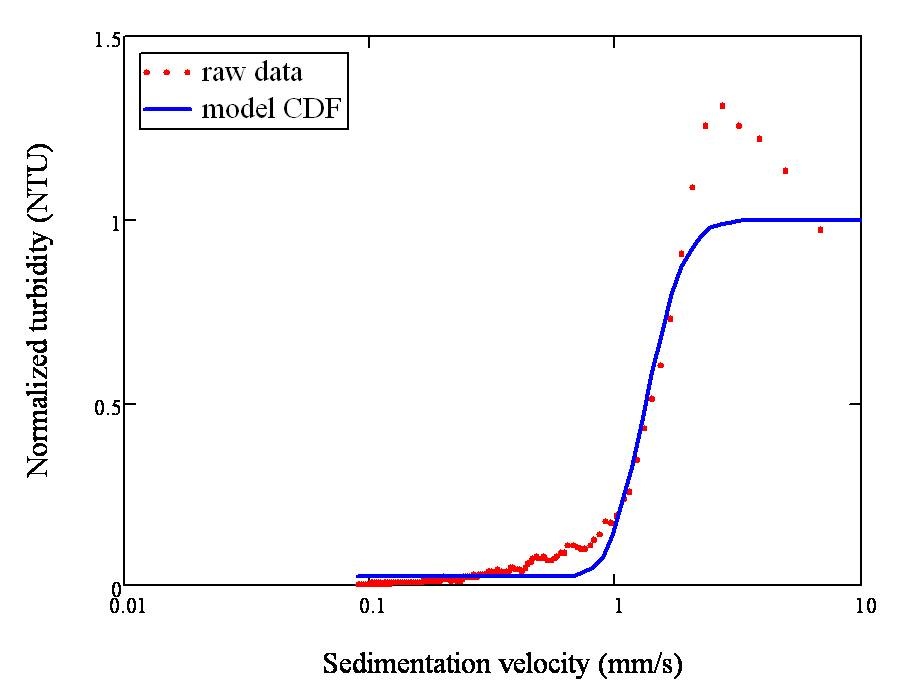
Figure 19*: Plot of the normalized turbidity as a function of sedimentation velocity for the ram data and the fitted data. 500 NTU water, alum dose of 50 mg/L, flocculator 5592 cm long
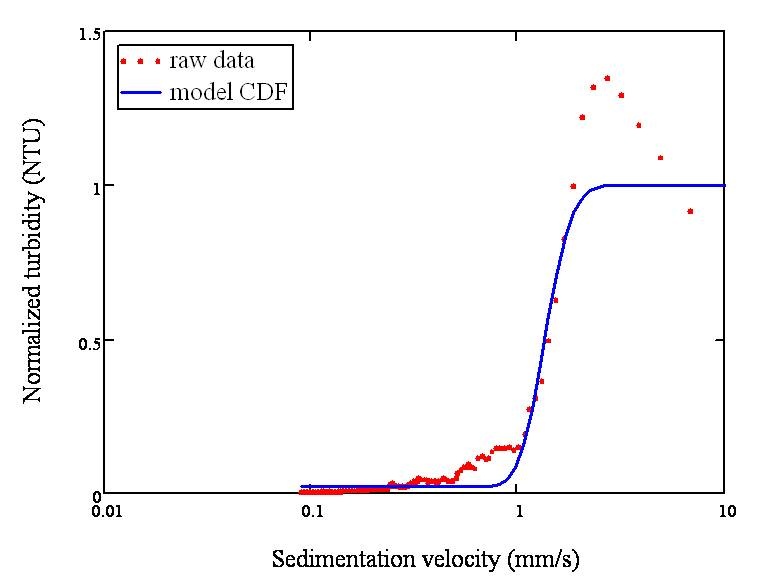
Figure 20*: Plot of the normalized turbidity as a function of sedimentation velocity for the ram data and the fitted data. 500 NTU water, alum dose of 70 mg/L, flocculator 5592 cm long
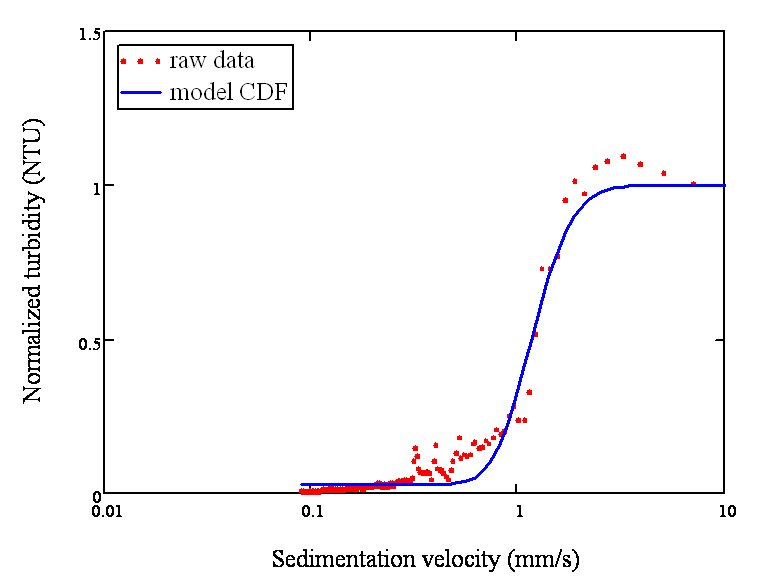
Figure 21*: Plot of the normalized turbidity as a function of sedimentation velocity for the ram data and the fitted data. 100 NTU water, alum dose of 100 mg/L, flocculator 5592 cm long