*** This version of Confluence is for testing only and contains a copy of content from June 29th 2026. No changes will be preserved. ***

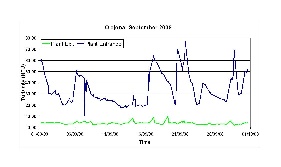
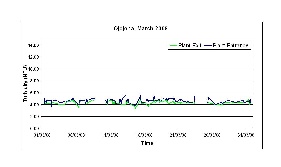
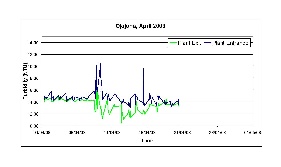
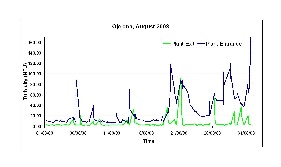
The graphs below are of turbidity data taken by the local plant operators. The operators work full-time at the plant and measure the turbdidity of the water entering and leaving the plant several times a day using an HF Scientific MicroTPW turbidimeter.
The Ojojona water board compiles the written data into an Excel spreadsheet and e-mails it to APP and Cornell.
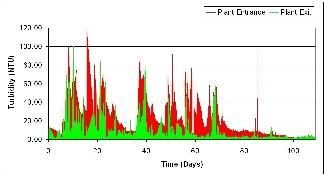
January
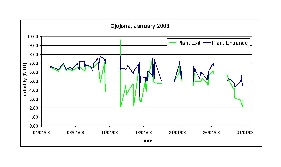
February
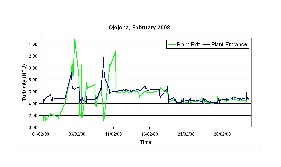
March
April
August
September