*** This version of Confluence is for testing only and contains a copy of content from June 29th 2026. No changes will be preserved. ***

...
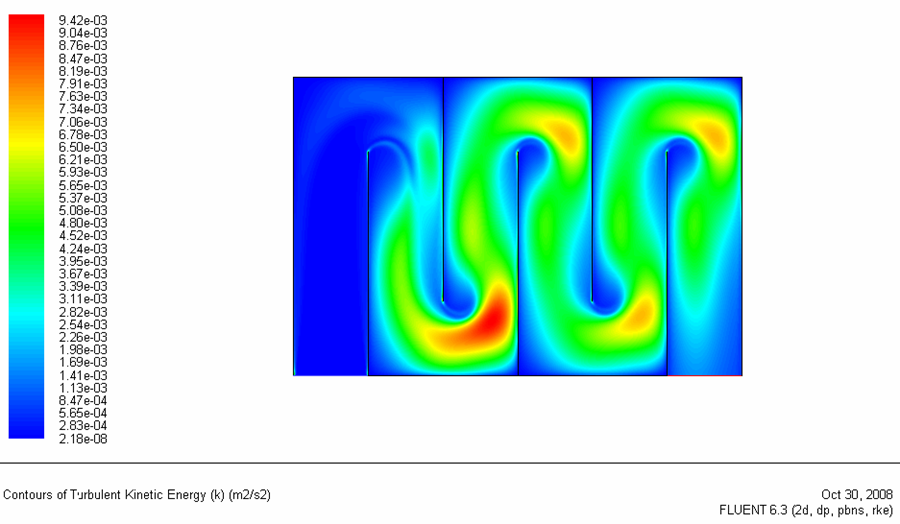
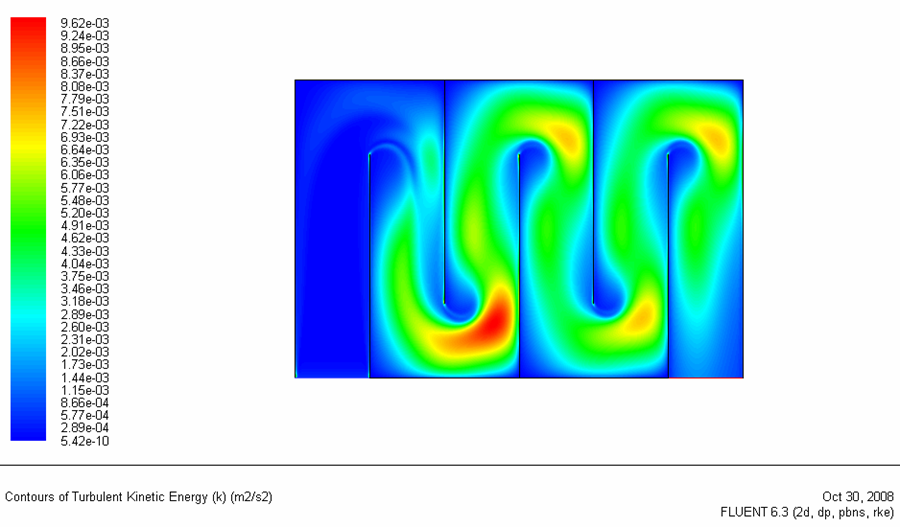
The effect of turbulence boundary condition is examined. The following three plots illustrate the result.
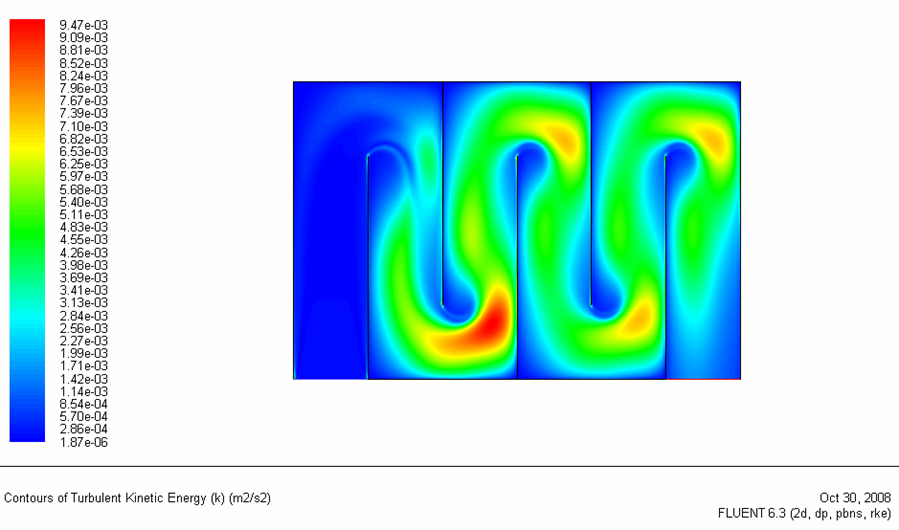 Figure
...
...
...
...
...
...
Comparing figure 1, 2 and 3, big changes of turbulence boundary conditions did not affect the solution much. We just need to do rough calculations on the parameters to input for accurate result. Final boundary condition is the Turbulent intensity of 10% and turbulent length scale of 0.004