 Sign-up for free online course on ANSYS simulations!
...
See below for tips on how to zoom in, zoom out etc.
Pressure Contours
| HTML |
|---|
<iframe width="560" height="315" src="https://www.youtube.com/embed/KU-zrgbSWO0" frameborder="0" allowfullscreen></iframe> |
Velocity Magnitude Contours
| HTML |
|---|
<iframe width="560" height="315" src="https://www.youtube.com/embed/VXyIicrrAdM" frameborder="0" allowfullscreen></iframe> |
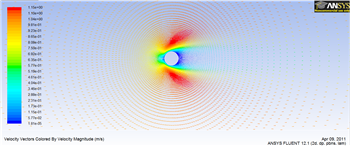
Velocity Vectors
Results > Graphics and Animations > Vectors > Set Up...
Then click Display. The Scale was set to 2 in the plot below.
| newwindow | ||||
|---|---|---|---|---|
| ||||
https://confluence.cornell.edu/download/attachments/144972154/VelVect2_Full.png |
Pressure Contours
...
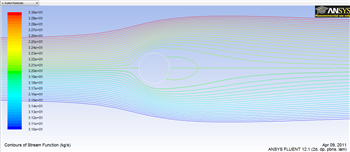
Stream Lines
Results > Graphics and Animations > Contours > Set Up...
Set Contours of to Velocity.. and set the box below to Stream Function. Make sure Filled is not selected and click Display. The plots below were created by setting levels to 40, deselecting Auto Range, setting Min (kg/s) to 31 and setting Max (kg/s) to 33.
| newwindow | ||||
|---|---|---|---|---|
| ||||
https://confluence.cornell.edu/download/attachments/144972154/StreamLines2_Full.png |
...