 Sign-up for free online course on ANSYS simulations!
...
| HTML |
|---|
<iframe width="640" height="360" src="//www.youtube.com/embed/3YJhB7VmVEw" frameborder="0" allowfullscreen></iframe> |
Wall Shear
We plot the wall shear using the procedure shown in the video below.
| HTML |
|---|
<iframe width="640" height="360" src="//www.youtube.com/embed/WiK1uBTdK-M?rel=0" frameborder="0" allowfullscreen></iframe> |
We then consider the trends in the wall shear in the heated, mixing and flow development sections and try to justify them through physical reasoning.
| HTML |
|---|
<iframe width="640" height="360" src="//www.youtube.com/embed/NbdGrJTesZg?rel=0" frameborder="0" allowfullscreen></iframe> |
You can spiff up your plot using the tips discussed below. This video also shows you how you could read in experimental results for comparing the wall shear between simulation and experiment.
((Video coming shortly))
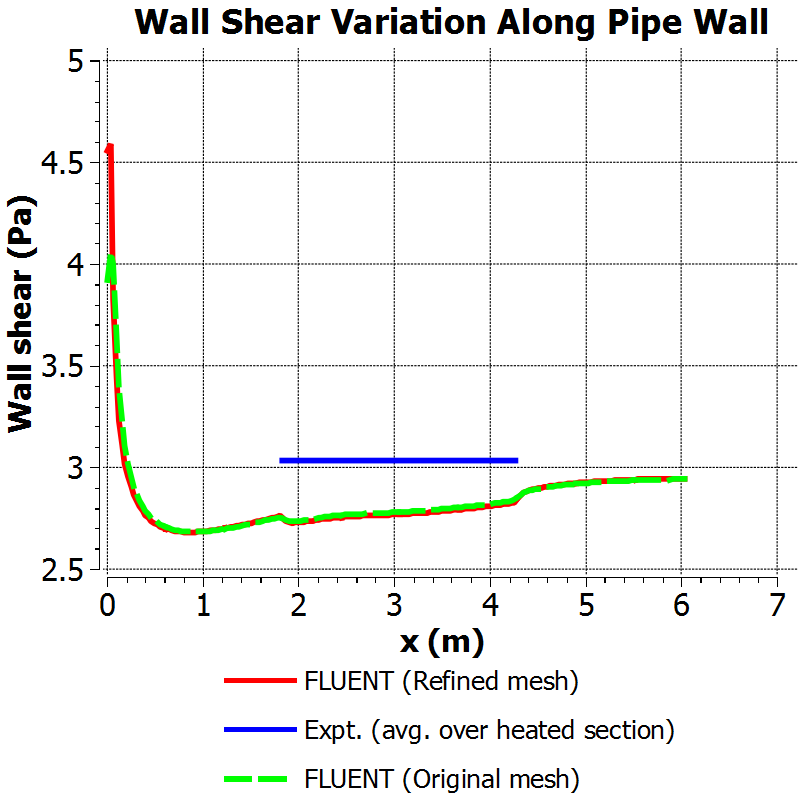
When the simulation was repeated for conditions for which experimental data are available, we got the comparison shown below. The difference in the average wall shear in the heated section between the simulation and experiment is a respectable 4%. Note that the wall shear in turbulent flows is difficult to predict accurately due to the steep velocity gradients at the wall.
Fanning Friction Factor
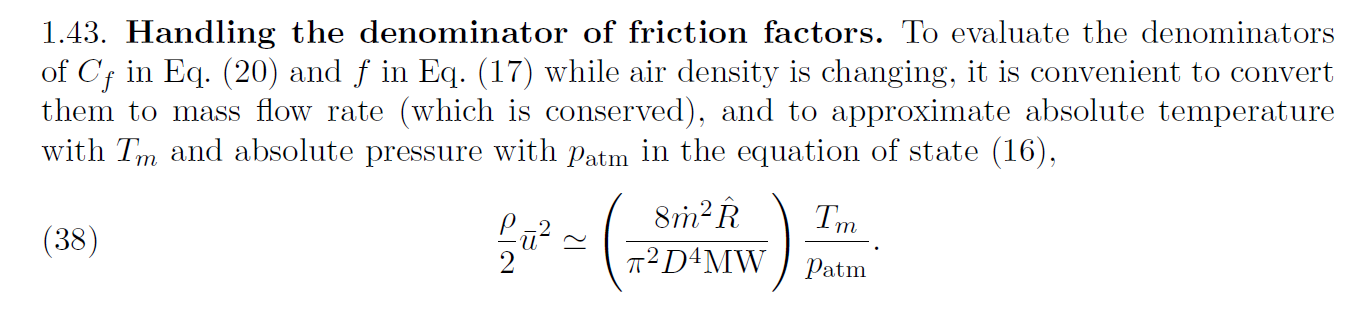
The Fanning friction factor, also called the skin friction coefficient, can be plotted using the procedure outlined in numerical results section of the laminar pipe flow tutorial (scroll down to the end). The reference values for density and velocity to be used need to be calculated using the procedure outlined in section 1.43 of the HT2 lab manual posted on Blackboard.below.
Input Summary
...