*** This version of Confluence is for testing only and contains a copy of content from June 29th 2026. No changes will be preserved. ***

...
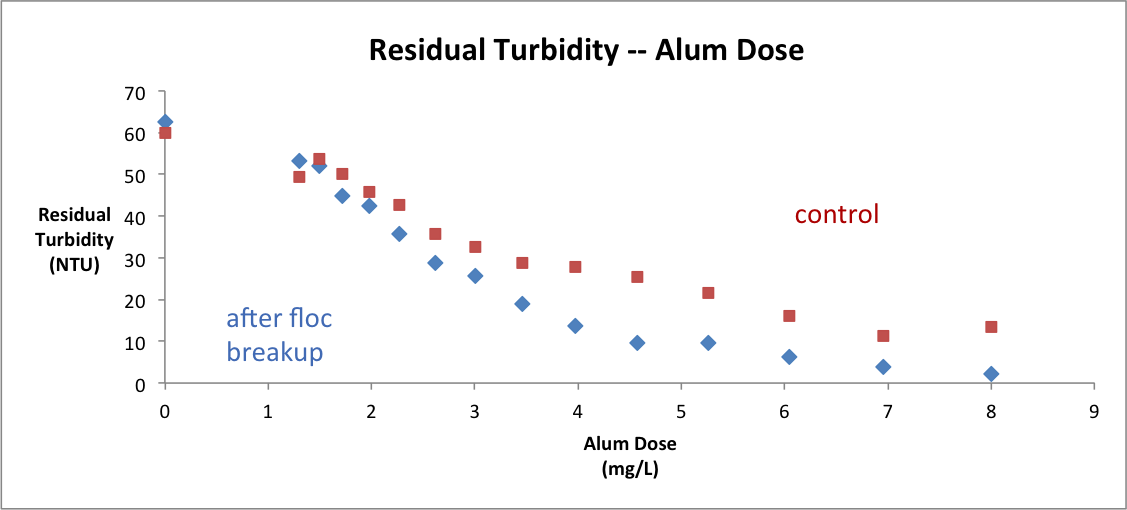 Figure 2 Comparative results of residual turbidity vs. alum dose
...
...
The Predictive model is supposed to be updated based on the experimental data after floc breakup device was installed. An approach to update existing model is to insert trend line to our existing experimental data and pick the best relationship for turbidity removal versus alum dose curve. Next we need to check how variables are changed after installation of floc breakup. Figure 3 indicates that the logarithmic type fits the data the best with a regression equation of y = 0.2062x -0.0078 and a relation coefficient of 0.9931.
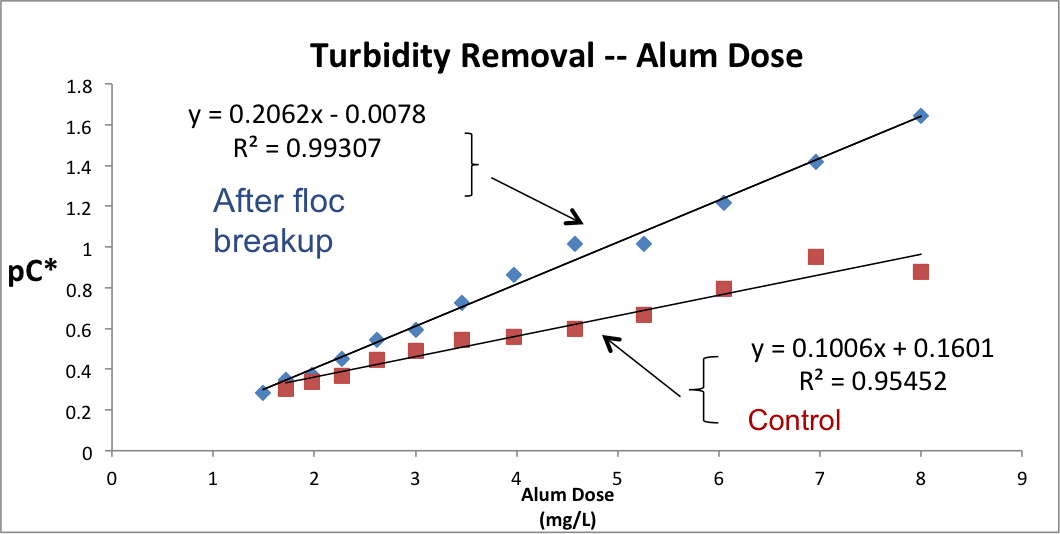
(Note: 2 experiment points at the beginning were not shown due to graphical trend line fitting)
The capacity of flocculator is based on it's ability to cause collisions between particles. Breaking large flocs that allow more collisions to happen may be helpful to achieve higher turbidity removal. Thus we need to design a special component that can break up flocs at regular intervals. For laboratory experiments, this special component can be an orifice or a wire mesh set at a size that correlates with the desired energy dissipation rate.