*** This version of Confluence is for testing only and contains a copy of content from June 29th 2026. No changes will be preserved. ***

...
Figure 2 demonstrates the comparative results of residual turbidity with floc breakup and without floc breakup. Obviously, the residual turbidity is lower after floc breakup device was installed. At the alum dose 4, 4.6 and 5.2 mg/L, the difference of residual turbidity between the 2 groups of data reaches 10 NTU. Both curve seems to fit into the logarithmic trend line. The results indicate that our hypothesis "large flocs are useless" may be correct and offers insight into improving AguaClara's current flocculator design. 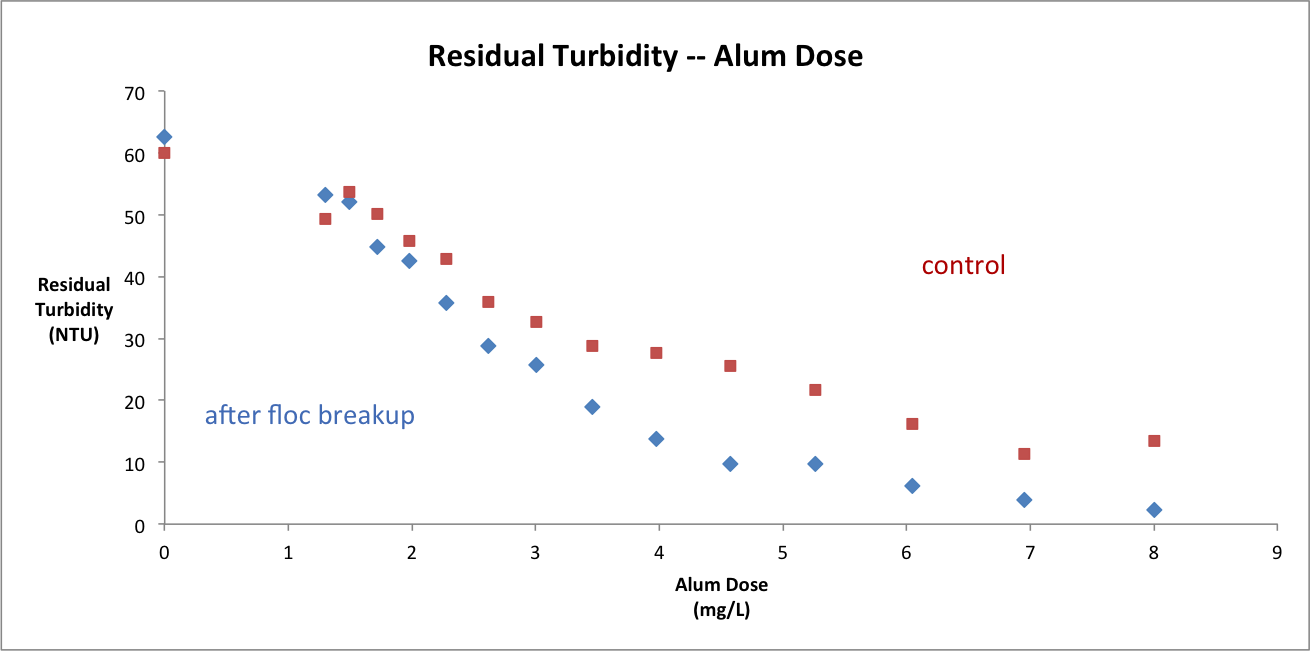
...
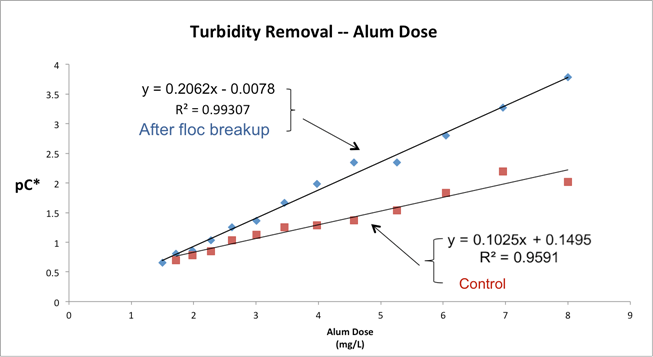
The Predictive model is supposed to be updated based on the experimental data after floc breakup device was installed. An approach to update existing model is to insert trend line to our existing experimental data and pick the best relationship for turbidity removal versus alum dose curve. Next we need to check how variables are changed after installation of floc breakup. Figure 3 indicates that the logarithmic type fits the data the best with a regression equation of y = 0.2062x -0.0078 and a relation coefficient of 0.9931.
...