*** This version of Confluence is for testing only and contains a copy of content from June 29th 2026. No changes will be preserved. ***

...
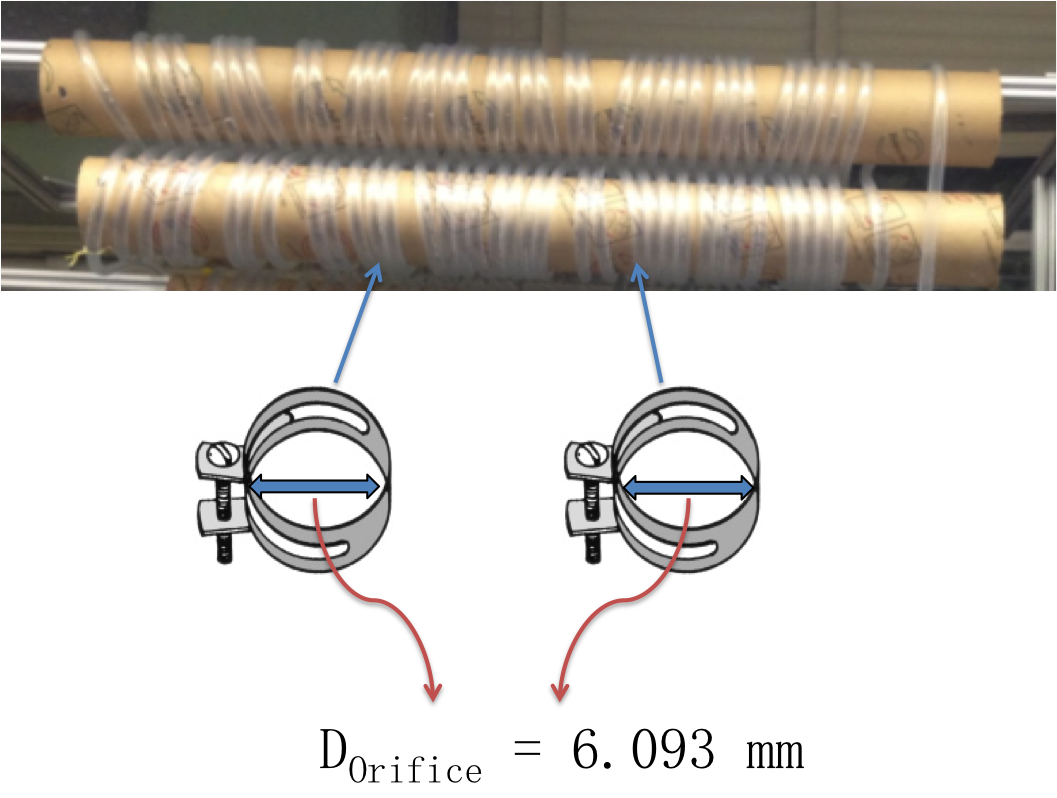
A floc breakup procedure was devised according to the calculations of energy dissipation rate, capture velocity, collision time. Six hose clamps were evenly placed onto tube flocculator (2 on each unit, see figure 1). The inner diameter of clamps are calculated based on the maximum energy dissipation rate. After the floc breakup device were set up, the flocculator were cleaned using a tiny sponge to remove the clay that sticked to the walls of flocculator. Then a complete experiment with the same method as the control experiment was conducted.
. 
...
...
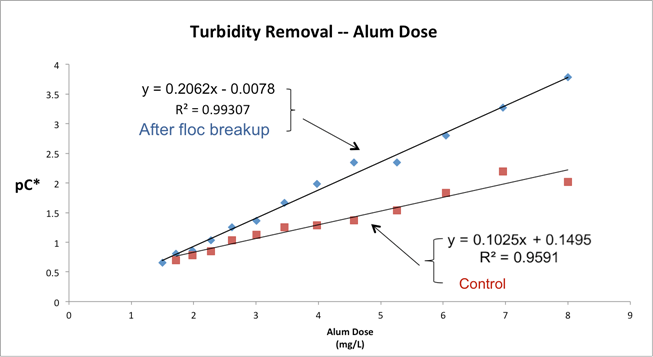
The Predictive model is supposed to be updated based on the experimental data after floc breakup device was installed. An approach to develop this model is to insert trend line to our existing experimental data and pick the best relationship for turbidity removal versus alum dose curve. Figure 3 indicates that the logarithmic type fits the data the best with a regression equation of y = 0.2062x -0.0078 and a relation coefficient of 0.9931.
...
...