*** This version of Confluence is for testing only and contains a copy of content from June 29th 2026. No changes will be preserved. ***

...
...
Figure 2 demonstrates the compared results of residual turbidity with floc breakup and without floc breakup. Obviously, the residual turbidity are lower when breaking the flocs using clamps. At the alum dose 4, 4.6 and 5.2 mg/L, the difference of residual turbidity curve reaches 10 NTU. Both curve seems to fit into the logarithmic trend line -- the one with floc breakup matches the trend line even with a correlation coefficient of 0.9934. These 2 trend lines verify the predictive model in Chapter 1. The results not only proves that our hypothesis "large flocs are useless" is right but also offers us insight into improving AguaClara's current flocculator design.
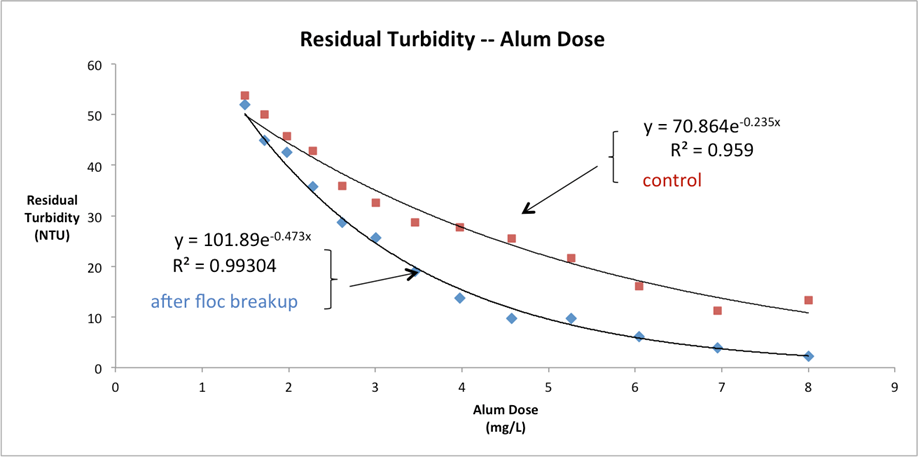
Figure 2 Comparative results of residual turbidity vs. alum dose