 Sign-up for free online course on ANSYS simulations!
...
In the Solution XY Plot select Mean Y Velocity under File Data and click Plot. The figure below shows the comparison of the mean Y velocity from k-e and LES simulations, both the results are very close which validates the solution procedure for the LES simulation.
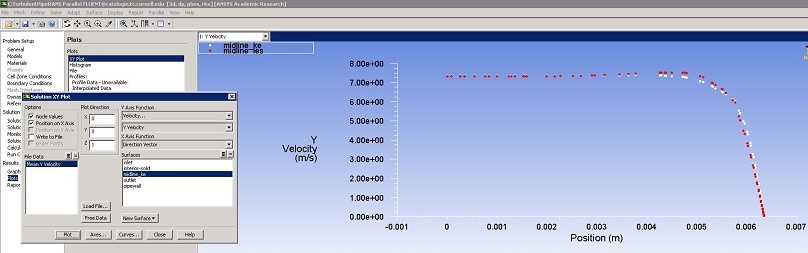
Click Here for Higher Resolution
...