 Sign-up for free online course on ANSYS simulations!
...
| Info | ||
|---|---|---|
| ||
We will use CFD-Post as the primary post processing GUI. Steps for post processing in FLUENT can be found here. |
Step 6
...
Velocity Vectors
...
https://confluence.cornell.edu/download/attachments/118771111/VectPlot_Full.png...
. Results
Double click on Results from the Workbench Window to launch CFD-Post.
Velocity Vectors
Click on the z-axis,  to view the XY plane. Click on the vector icon to insert a vector plot. Name it Velocity Vector.
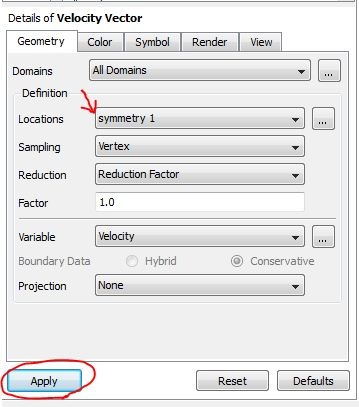
A panel named "Details of Velocity Vector" will appear right below the outline window. Set the Locations to symmetry 1. Click on Apply to display the velocity vectors.
The velocity vectors will be displayed in the view window.
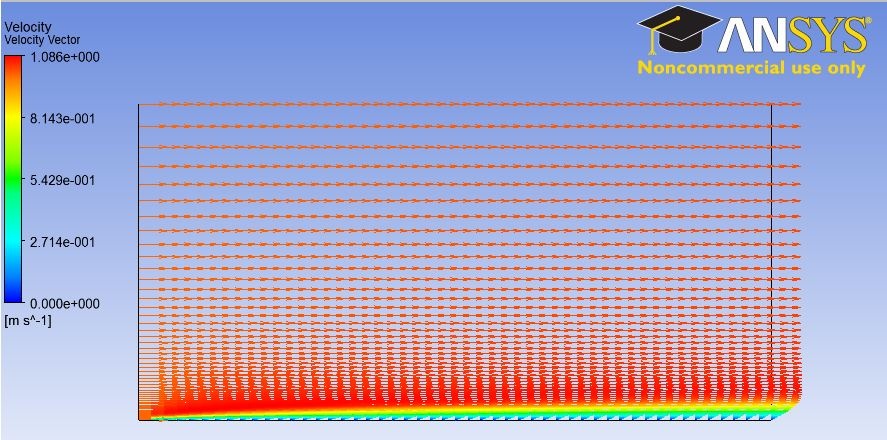
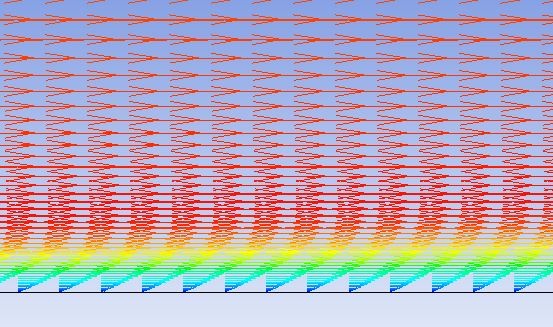
You can use the wheel button of the mouse to zoom into the region that closely surrounds the plate, to get a better view of the boundary layer velocities:
...
https://confluence.cornell.edu/download/attachments/118771111/VectPlot2_Full.pngOutlet Velocity Profile
...
https://confluence.cornell.edu/download/attachments/118771111/xyplotsetup_Full.png...
https://confluence.cornell.edu/download/attachments/118771111/SolXY1_Full.png...
https://confluence.cornell.edu/download/attachments/118771111/XVelPlot1_Full.png...
https://confluence.cornell.edu/download/attachments/118771111/Curv2_Full.png...
https://confluence.cornell.edu/download/attachments/118771111/AxesMen1_Full.png...
https://confluence.cornell.edu/download/attachments/118771111/Axes2_Full.png...
https://confluence.cornell.edu/download/attachments/118771111/Plot5_Full.png...
https://confluence.cornell.edu/download/attachments/118771111/Plot6_Full.png...
Mid-Section Velocity Profile
...
https://confluence.cornell.edu/download/attachments/118771111/SurfLinRake_Full.png...
https://confluence.cornell.edu/download/attachments/118771111/Plot1M_Full.png...
https://confluence.cornell.edu/download/attachments/118771111/Plot2M_Full.png...
Pressure Coefficients
...
https://confluence.cornell.edu/download/attachments/118771111/CompInlet_Full.png...
https://confluence.cornell.edu/download/attachments/118771111/ContPlot_Full.png...
https://confluence.cornell.edu/download/attachments/118771111/Contou_Full.png...
https://confluence.cornell.edu/download/attachments/118771111/ContP1_Full.png...
https://confluence.cornell.edu/download/attachments/118771111/ContZoom_Full.pngSkin Friction Coefficient
...
https://confluence.cornell.edu/download/attachments/118771111/SolXY3_Full.png...
https://confluence.cornell.edu/download/attachments/118771111/SkinFric1_Full.png...
https://confluence.cornell.edu/download/attachments/118771111/SkinFric2_Full.png...
Drag
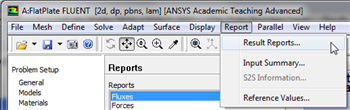
Now, we will obtain the drag on the plate. First, click on Report then click on Result Reports..., as shown in the following image.
newwindow
https://confluence.cornell.edu/download/attachments/118771111/Report_RR_Full.png
https://confluence.cornell.edu/download/attachments/118771111/ForceRep_Full.png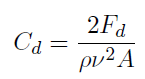
In the case here, the density, viscosity and area all have values of 1. Thus, the equation above reduces to the following equation.
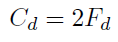
The results from ANSYS FLUENT agree with the theory here since the drag coefficient is approximately twice the value of the drag.
Now, save your work in the FLUENT window, then close the FLUENT window.
Go to Step 7: Verification & Validation
See and rate the complete Learning Module
Go to all FLUENT Learning Modules