 Sign-up for free online course on ANSYS simulations!
...
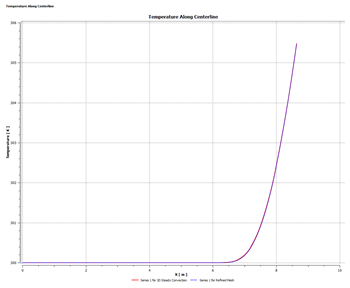
Next, open the Post Processor of the Refined Mesh project instance by double clicking  . In the Outline, select the Temperature Along Centerline chart. Next, go to the Line Display tab. You should see there are two series on the graph. Select the Series 1 for Refined Mesh, change Line Style to Dot, and press Apply. You should now see two plotted lines on the plot, as below.
| newwindow | ||||
|---|---|---|---|---|
| ||||
https://confluence.cornell.edu/download/attachments/146921325/ComparisonChart1Large.png?version=1&modificationDate=1305670372000 |
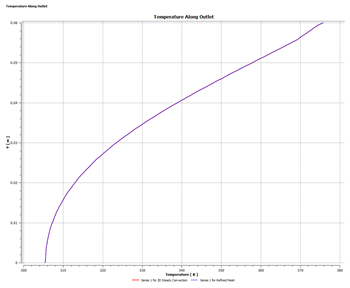
Repeat this process for the Temperature Along Outlet chart.
| newwindow | ||||
|---|---|---|---|---|
| ||||
https://confluence.cornell.edu/download/attachments/146921325/ComparisonChart2Large.png?version=1&modificationDate=1305670491000 |