 Sign-up for free online course on ANSYS simulations!
...
| newwindow | ||||
|---|---|---|---|---|
| ||||
https://confluence.cornell.edu/download/attachments/146921323/ChartLarge.png?version=1&modificationDate=1305402293000 |
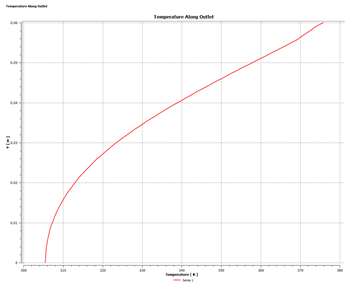
Graph of Temperature along Outlet
To graph the temperature along the outlet, we need to create the outlet as a path much like we did with the centerline. Click on the Location icon  , select Line, and name the line
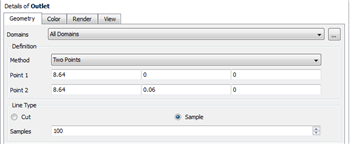
 Outlet. In the Details of Centerline window, set the Method to two points. Point 1 is (8.64,0,0), and Point 2 is (8.64,0.06,0). Enter these values into the details window. Next, change the number of Samples to 100. Press Apply once finished.
Next, press the chart icon  . When prompted, name the page
 Temperature Along Outlet. In the Details of Temperature Along Outlet window, begin on the General tab. In the Title, enter Temperature Along Outelt. Next, click on the Data Series tab. Under Data Source, in the drop down menu next to Location, select Outlet. Now move to the X Axis tab. In the drop down menu next to Variable, and select Temperature. In the Y Axis tab, change the Variable to Y. when finished, press Apply to see the chart.
We are now ready to validate and verify our results.
...