 Sign-up for free online course on ANSYS simulations!
...
Streamlines
To view the streamlines, keep the Contours window open, and change the Contours Of box to Velocity, and the box below to Stream Function. Change Levels to 100. Also, uncheck the box marked Auto Range, and set Min(kg/s) to 13.11, and Max(kg/s) to 14.16
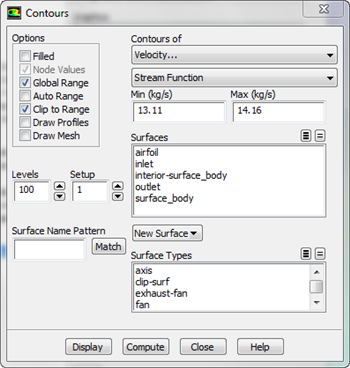
To view the streamlines, press Display...
Pressure Coefficient
Next, we will plot the pressure coefficient along the surface of the airfoil. Click on Results > Plots to open up the Plots Window. Under Plots, select XY Plot, and click Set Up.... In the window that pops up, change the settings Y-Axis Function > Pressure, and change the second box to Pressure Coefficient. Ensure X-Axis Function > Direction Vector. Under Surfaces, select airfoil. See the figure below for help.
...