 Sign-up for free online course on ANSYS simulations!
...
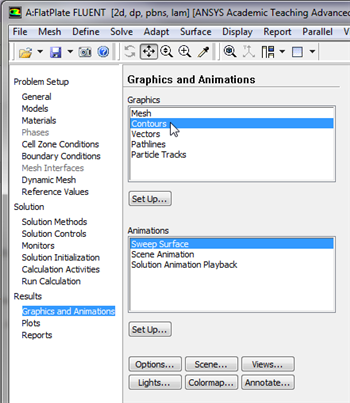
Next, click on Graphics and Animations, then double click on Contours, as shown below.
| newwindow | ||||
|---|---|---|---|---|
| ||||
https://confluence.cornell.edu/download/attachments/118771111/ContPlot_Full.png |
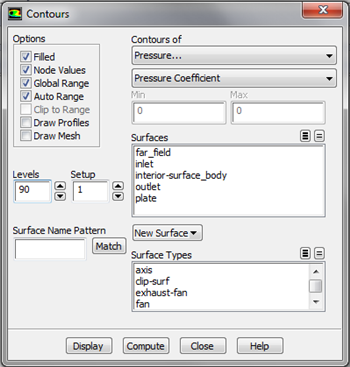
In the Contours menu, set Contours of to Pressure... and set the box below to Pressure Coefficient. Next, select Filled and set Levels to 90. Your Contours menu should look exactly like the following image.
| newwindow | ||||
|---|---|---|---|---|
| ||||
https://confluence.cornell.edu/download/attachments/118771111/Contou_Full.png |
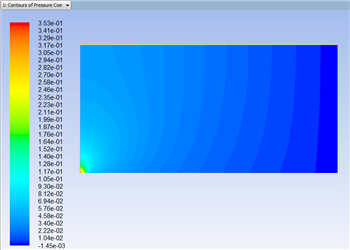
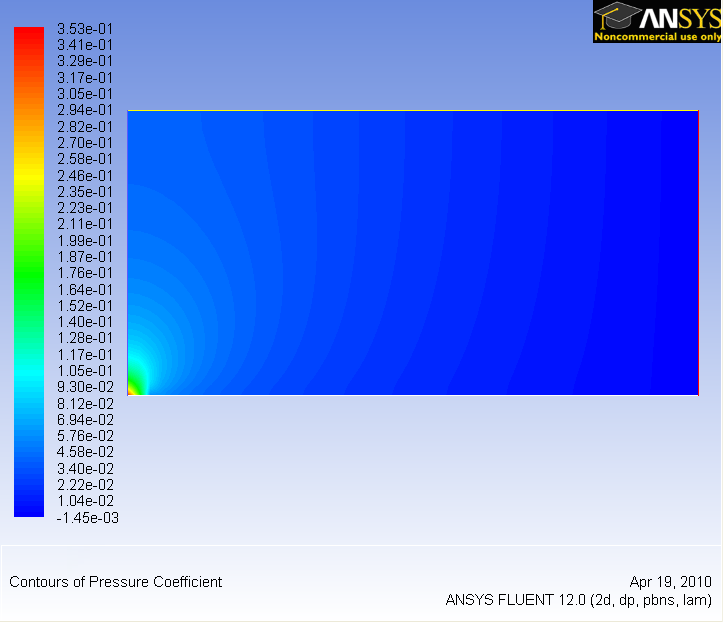
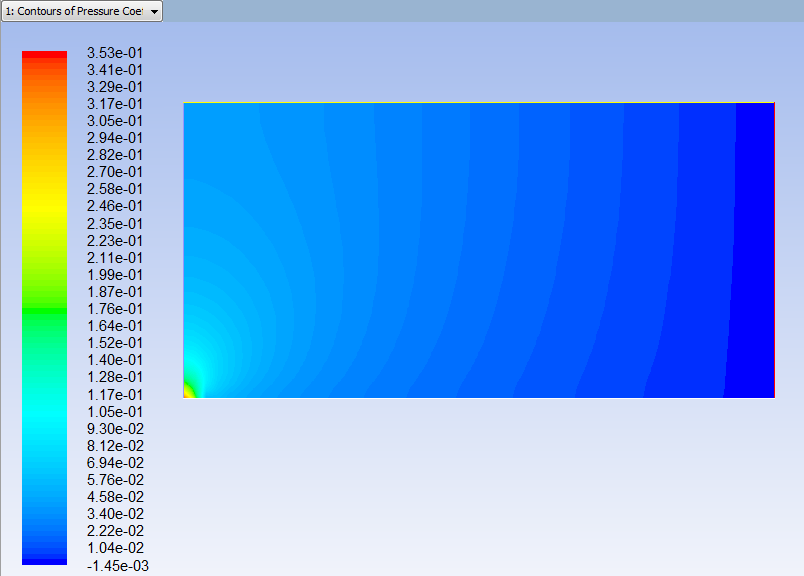
Lastly, click Display in the Contours menu to generate the contour plot. You should obtain the following output.
| newwindow | ||||
|---|---|---|---|---|
| ||||
https://confluence.cornell.edu/download/attachments/118771111/ContP1_Full.png |
...
https://confluence.cornell.edu/download/attachments/118771111/step6_002.png?version=1
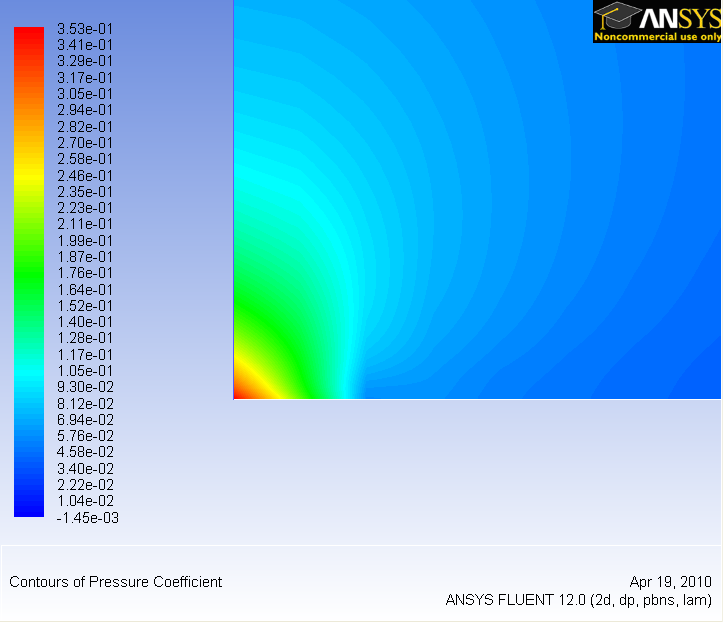
You can zoom then zoom in to the leading edge of the plate with the wheel mouse button as shown below.
" rel="nofollow"linktype="raw" linktext="https://confluence.cornell.edu/download/attachments/118771111/ContP1_Full.png
| newwindow |
|---|
\\  !step6_002.png|width=298,height=255!
{newwindow: Higher Resolution Image}https://confluence.cornell.edu/download/attachments/118771111/step6_002.png?version=1 |
">https://confluence.cornell.edu/download/attachments/118771111/ContP1_Full.png
| newwindow |
|---|
\\  !step6_002.png|width=298,height=255!
{newwindow: Higher Resolution Image}https://confluence.cornell.edu/download/attachments/118771111/step6_002.png?version=1 |
| newwindow | ||||
|---|---|---|---|---|
| ||||
https://confluence.cornell.edu/download/attachments/118771111/ |
...
ContZoom_ |
...
Full.png |
...
Why is the pressure not constant at the leading edge of the plate?
Plot Skin Friction Coefficient
...