*** This version of Confluence is for testing only and contains a copy of content from June 29th 2026. No changes will be preserved. ***

...
Since the mean sedimentation velocities are calculated when we fit the data, the mean sedimentation velocities given for a 5 NTU influent water are not accurate. Indeed, even if the data processor tries to fit the data, shape of the evolution of turbidity as a function of sedimentation velocity (figure 17) does not look like the fit function.
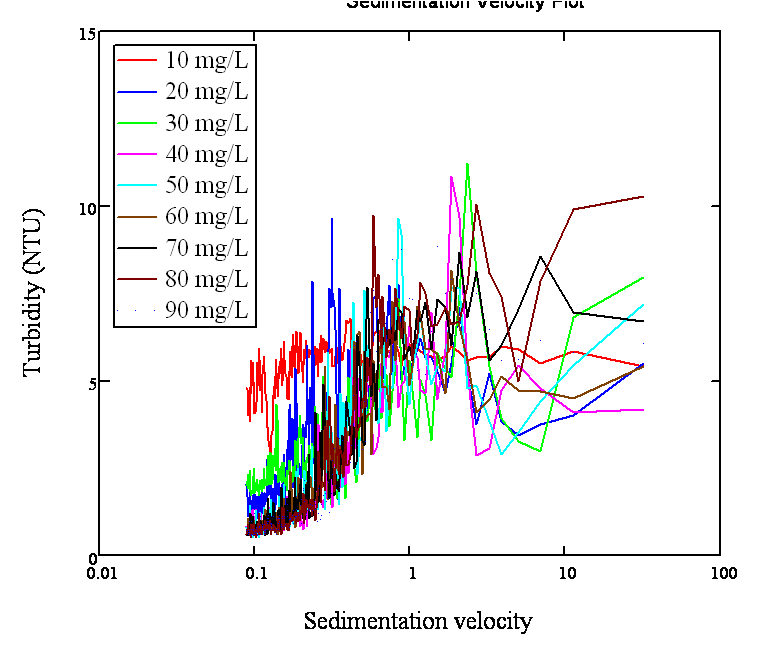
Figure 17: Plot of the turbidity vs sedimentation velocity for an influent water of 5 NTU. Flocculator 2787 cm long
For 100 NTU and 500 NTU, the fitted data seem accurate enough that we can trust the mean sedimentation velocities or the coefficient of variation retrieved. Data retrieved at low alum dosage seems to be really well fitted. However, at higher alum concentrations, at some points, raw data seems to have a behavior slightly different than the gamma function (figure ??)
!500 NTU,length2 1.jpg width=550,height=400,align=center!
Figure 18: Plot of the normalized turbidity as a function of sedimentation velocity for the ram data and the fitted data. 500 NTU water, alum dose of 10 mg/L, flocculator 5592 cm long
!500 NTU,length2 5.jpg width=550,height=400,align=center!
Figure 19*: Plot of the normalized turbidity as a function of sedimentation velocity for the ram data and the fitted data. 500 NTU water, alum dose of 50 mg/L, flocculator 5592 cm long
!500 NTU,length2 7.jpg width=550,height=400,align=center!
Figure 20*: Plot of the normalized turbidity as a function of sedimentation velocity for the ram data and the fitted data. 500 NTU water, alum dose of 70 mg/L, flocculator 5592 cm long
!100 nTU, length2 10.jpg width=550,height=400,align=center!
Figure 21*: Plot of the normalized turbidity as a function of sedimentation velocity for the ram data and the fitted data. 100 NTU water, alum dose of 100 mg/L, flocculator 5592 cm long