*** This version of Confluence is for testing only and contains a copy of content from June 29th 2026. No changes will be preserved. ***

...
Every experiment was replicated to test the reliability of the results given by FReTA. The comparison between the mean residual turbidities of the experiments and their replicates has been explained in a revious paragraph. Mean sedimentation velocities were also compared. The figure ? ? 14,15 and 16 show that our experiments were quite accurate when analyzing mean sedimentation velocities.
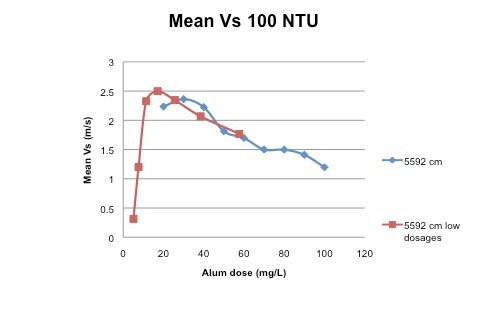
Figure 14: Plot of the mean sedimentation velocities as a function of alum dose for an effluent water of 100 NTU at the smallest length of the flocculator (2787 cm)
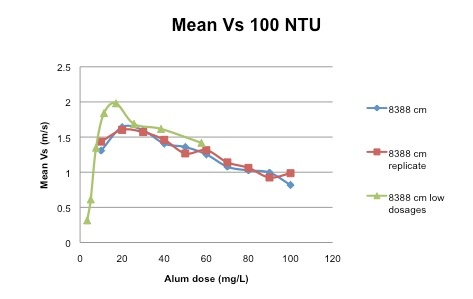
Figure 15: Plot of the mean sedimentation velocities as a function of alum dose for an effluent water of 100 NTU at the medium length of the flocculator (5592 cm)
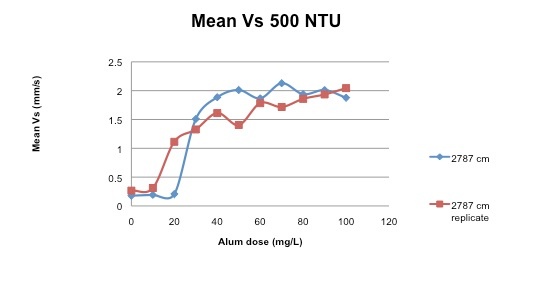
Figure 16: Plot of the mean sedimentation velocities as a function of alum dose for an effluent water of 500 NTU at the smallest length of the flocculator (2787 cm)
Mean sedimentation velocities :
...