*** This version of Confluence is for testing only and contains a copy of content from June 29th 2026. No changes will be preserved. ***

...
The following two graphs show the temperature as a function of time for the two tests.
Figure 1 - Temperature vs. Time for Test 1
...
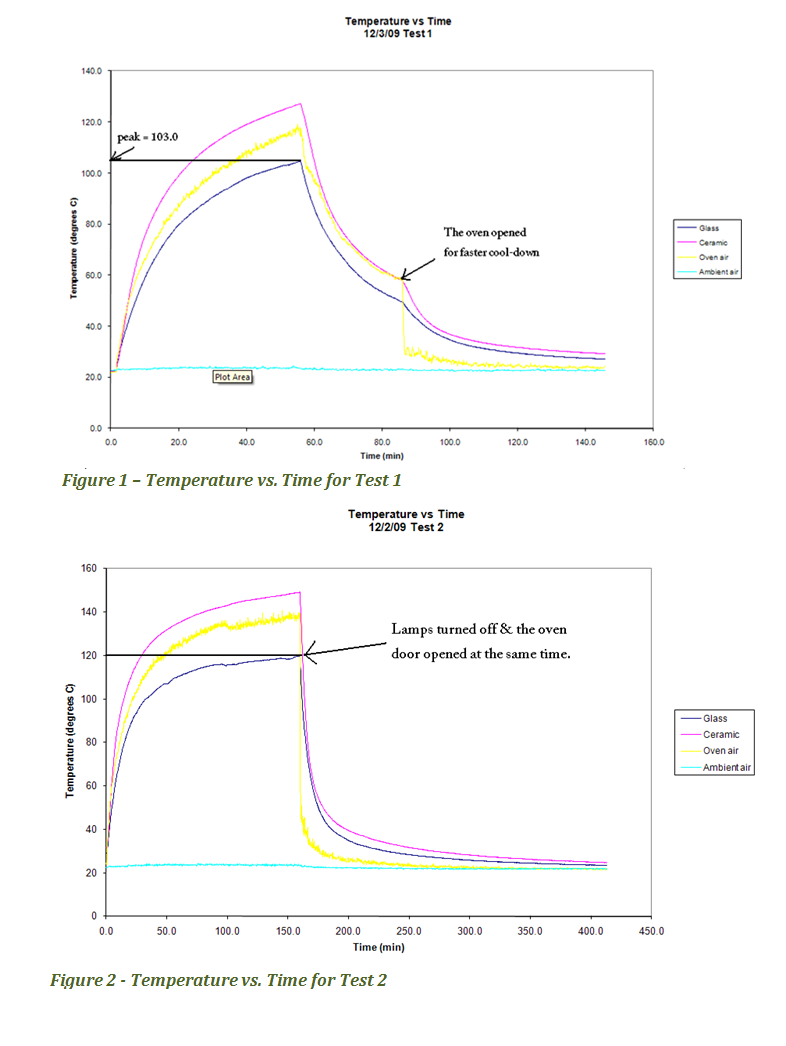
The above plots show that the glass and ceramic cooled down (Test 2) significantly faster than it heated up (Test 1). The piece of ceramic was placed on the black plate, so it reached the highest temperature of all four measurements in the graph. The temperature of glass was about 20^°^C below that of the oven air for both tests, while the ambient air in the lab stayed the same. Since the cool-down of "test 2" was significantly faster than the heating up of "test 1", the strain will also differ between the two tests, as discussed in the following paragraphs.
...