*** This version of Confluence is for testing only and contains a copy of content from June 29th 2026. No changes will be preserved. ***

...
For a 100 NTU influent water, see figure ? below (plot of the mean sedimentation velocity as a function of alum dose for an influent water of 100 NTU and a flocculator 2787 cm long), at a really low alum dose, the mean sedimentation velocities of the flocs increase up to a maximum and then a further increase in alum dose will make the mean sedimentation velocity of the flocs decrease. This could be explained by the fact that alum is less dense than clay. At low alum dose, alum precipitating allows the clay particles to stick to each other and to grow bigger but the majority of the floc is clay. After a certain alum dose, the hypothesis is that flocs grow so big that they are vulnerable to shear stress and break up in the flocculator and then reflocculate. Equilibrium is then reached between floc break up and flocculation producing a similar distribution of particles sizes when increasing alum dose. However, when increasing the alum dose the ratio of clay to alum inside a floc increases and because alum is less dense than clay, flocs are more buoyant making their mean sedimentation velocity decrease.
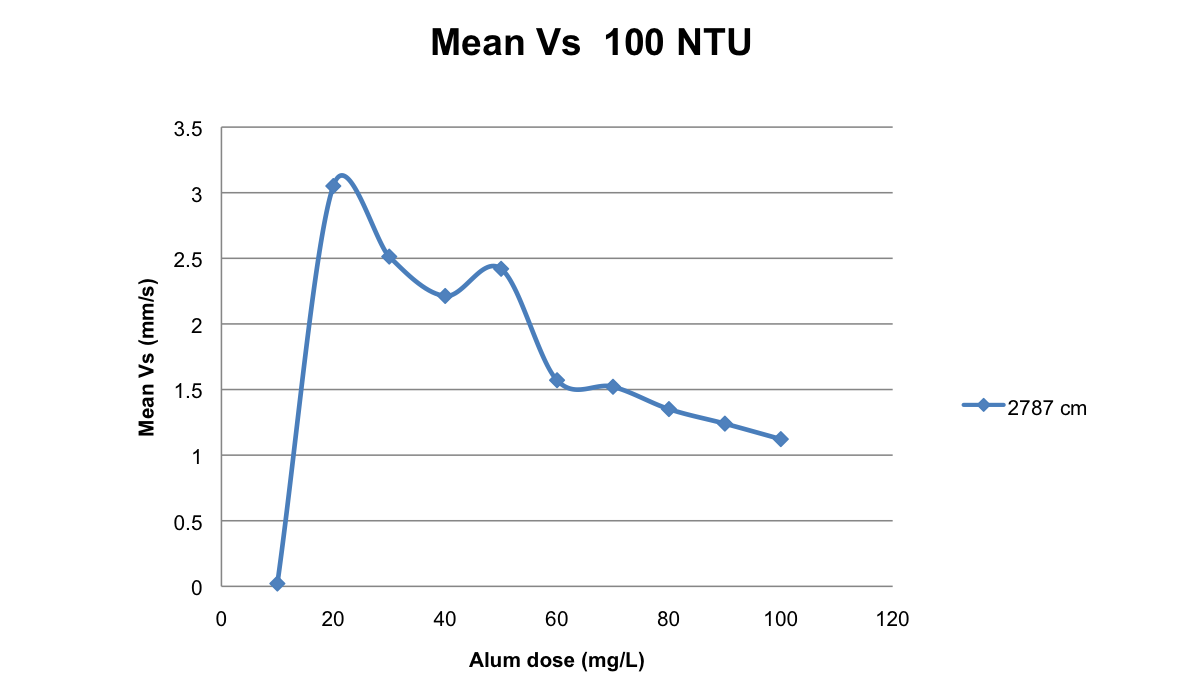
Figure ?: Plot of the mean sedimentation velocities as a function of alum dose for an effluent water of 500 NTU and a flocculator 2787 longFor an influent water of 500 NTU, the evolution of mean sedimentation velocities is different. Figure ? below is a plot of the mean sedimentation velocity as a function of alum dose for an influent water of 500 NTU and a flocculator 2787 cm long. At low alum dose, mean sedimentation velocities increase with the alum dose. However, after a certain alum dose, mean sedimentation velocities reach a threshold. This could be explained by the fact that high turbidity water is flocculated quite quickly because the average time between two collisions is short and we hypothesize that flocs grow only to a certain point before they become too big and vulnerable to fluid shear stresses that break them. Like the 100 NTU water, after a characteristic time, a steady state is reached between flocculation and fragmentation and the floc size distributions stay constant. However, in the case of 500 NTU water, there is so much clay that increasing alum dose doesn't make the flocs less dense.
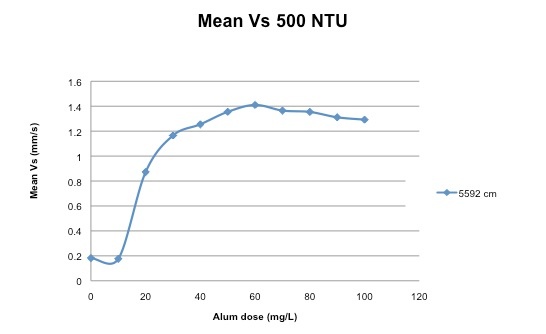
Figure ?: Plot of the mean sedimentation velocities as a function of alum dose for an effluent water of 100 NTU and a flocculator 2787 longMean sedimentation velocities are also influenced by the length of the flocculator. Figure ? and ?, show mean sedimentation as a function of alum dose for three different lengths of flocculator. In figure ? , experiments were conducted with an influent water of 100 NTU and for figure ?, the experiments were conducted with an influent water of 500 NTU. On these two graphs the same trend can be observed when varying flocculator length. When the increasing flocculator length, the mean sedimentation velocities follow the same trend as alum dose increases but their corresponding magnitude decreases.
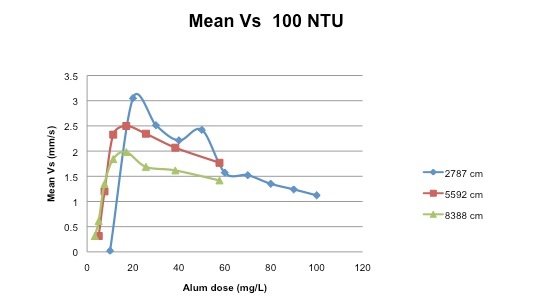
Figure ?: Plot of the mean sedimentation velocities as a function of alum dose for an effluent water of 100 NTU at different length of the flocculator (2787 cm, 5592 cm, 8388 cm)
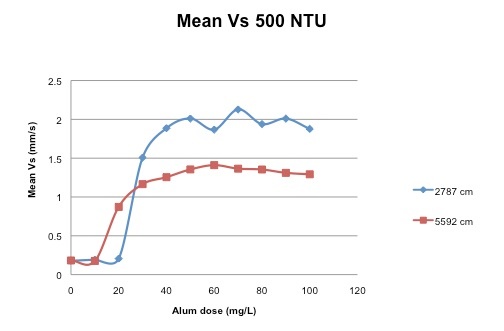
Figure ?: _Plot of the mean sedimentation velocities as a function of alum dose for an effluent water of 500 NTU at different length of the flocculator (2787 cm, 5592 cm, 8388 cm)_
It is interesting to observe the evolution of the coefficient of variation of sedimentation velocities as alum dose is increased. The coefficient of variation is the ratio of the standard deviation of the distribution of velocities divided by the mean of the sedimentation velocities:
Figure ? shows the evolution of the coefficient of variation as a function alum dose for an influent water of 100 NTU. It can be observed that the coefficient of variation decreases when we increase alum dose at a low alum dose. A decreasing coefficient of variation means that the distribution of particle size is getting narrower. However, after a certain alum dose, increasing the alum concentration makes the coefficient of variation increase. The spread of the sedimentation velocities is slightly getting larger with increasing alum dose.
Figure ?: _Plot of the coefficient of variation as a function of alum dose for an effluent water of 100 NTU at different length of the flocculator (2787 cm, 5592 cm, 8388 cm)_
Figure ? shows the evolution of the coefficient of variation as a function alum dose for an influent water of 500 NTU. In this case, the coefficient of variation decreases with increasing alum dose at low alum concentrations up to a point where the coefficient of variation stays constant with increasing alum dose. This would mean that after a certain alum dose, increasing the dosage doesn't affect the distribution of the particle size. This is consistent with the hypothesis of a steady state in the flocculator.
Figure ?: Plot of the coefficient of variation as a function of alum dose for an effluent water of 500 NTU at different length of the flocculator (2787 cm, 5592 cm)Reliability of the dataReplicability:
Every experiment was replicated to test the reliability of the results given by FReTA. The results were quite good for the 5 NTU water as you can see on figure ? A and B. For experiments at 100 and 500 NTU, looking at residual turbidity don't really seem accurate, figure ? and ?. This could be explained by the fact that alum clogged the connector where alum and water are mixing and this problem was found later. However, we felt confident using the data since the experiments and their replicate were really close on the mean sedimentation velocities graphs.
...
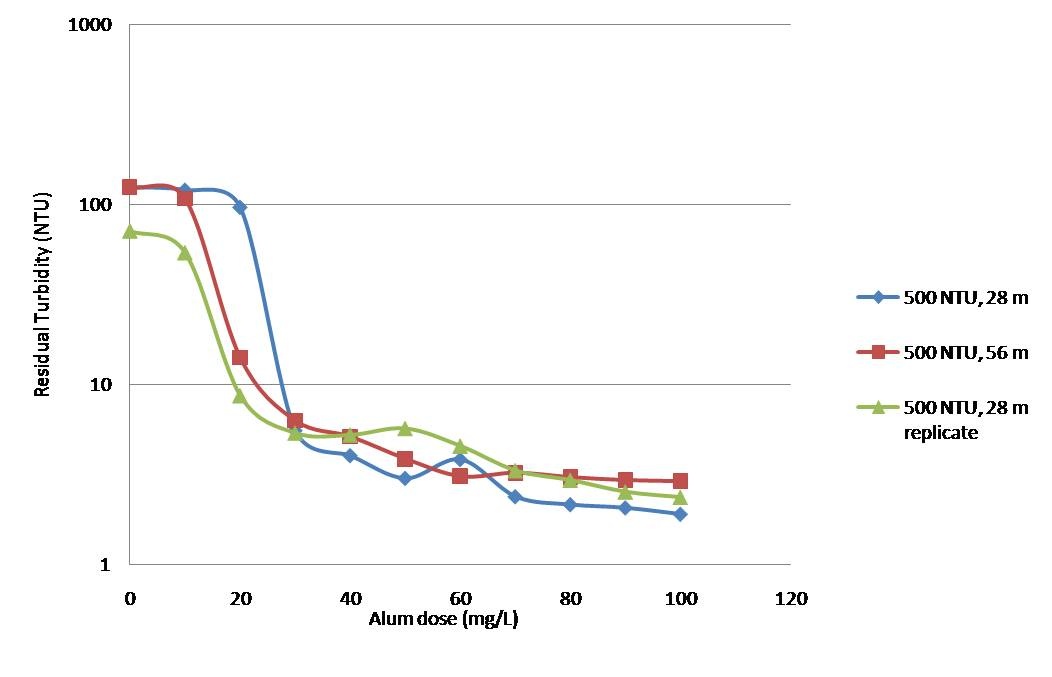
Figure 8: _Comparison of residual turbidity vs. alum dose for two different flocculator lengths of 2796cm and 5592cm with influent water at 500 NTU._
For the 500 NTU experiments, similar minimal residual turbidities were achieved using flocculator lengths of 2796cm and 8388cm of around 2 NTU. Additionally both showed similar behaviors to what was observed before. It is unclear if the 5592cm flocculator achieved its minimum residual turbidity faster than the 2796cm flocculator since it is bounded on both sides by a 2796cm replicate. Further data is needed to draw conclusions regarding how flocculator length impacts residual turbidity with 500 NTU water.
Reliability of the data
Replicability:
Every experiment was replicated to test the reliability of the results given by FReTA. The results were quite good for the 5 NTU water as you can see on figure ? A and B. For experiments at 100 and 500 NTU, looking at residual turbidity don't really seem accurate, figure ? and ?. This could be explained by the fact that alum clogged the connector where alum and water are mixing and this problem was found later. However, we felt confident using the data since the experiments and their replicate were really close on the mean sedimentation velocities graphs.
A
B
Figure ?: Plot of the residual turbidity as a function of alum dose for an effluent water of 5 NTU and it's replicate A: For a flocculator 2787 cm long. B: For a flocculator 8388 cm long.
Figure ?: Plot of the residual turbidity as a function of alum dose for an effluent water of 100 NTU and it's replicate for a flocculator 5592 cm long
Figure ?: Plot of the residual turbidity as a function of alum dose for an effluent water of 500 NTU and it's replicate for a flocculator 2787 cm long
Mean sedimentation velocities :
The data processor retrieves mean sedimentation velocities of the particles at each alum dose during an experiment from our data. Since the mean sedimentation velocities are calculated when we fit the data, the mean sedimentation velocities given for a 5 NTU influent water are not accurate. Indeed, even if the data processor tries to fit the data, the shape of the evolution of turbidity as a function of sedimentation velocity does not look like the fit function.