*** This version of Confluence is for testing only and contains a copy of content from June 29th 2026. No changes will be preserved. ***

...
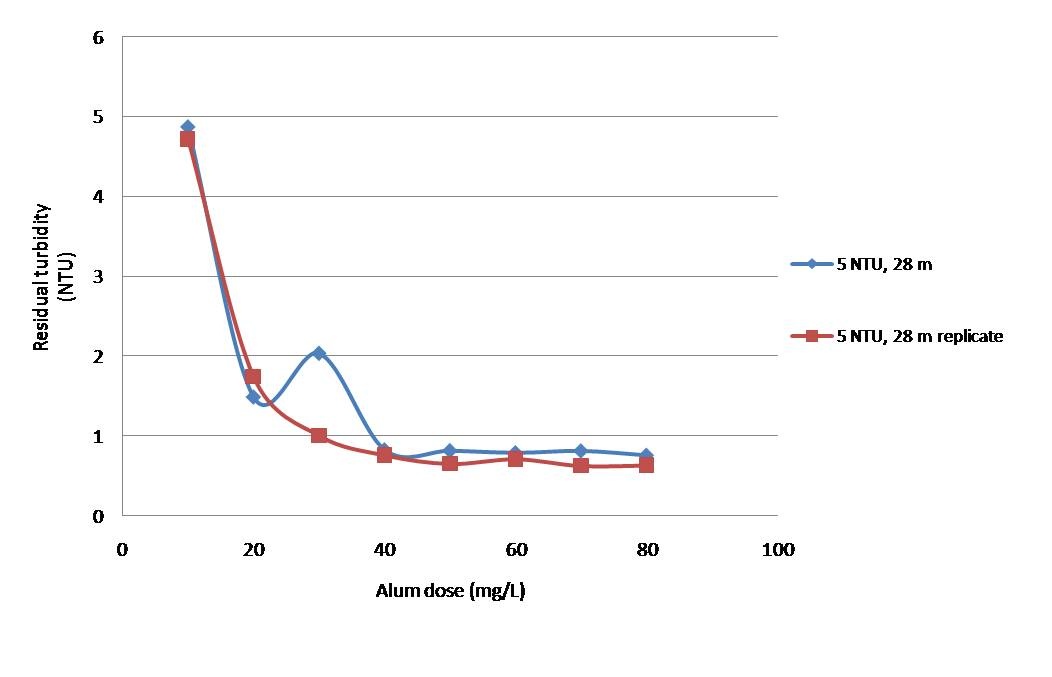
Figure 1: Residual turbidity vs. alum dose for 5 NTU influent water for a flocculator length of 2796cm.
Both of our replicates for a flocculator of 2796cm showed close agreement. Starting at a residual turbidity close to 5 NTU with an alum dose of 10mg/L, the residual turbidity dropped with increased alum dose until it appears to hit a limiting value of about 0.8 NTU with an alum dose of 50 mg/L. After this point, increasing alum dose no longer appears to have an effect on residual turbidity. We hypothesize that initially, floc buildup is the dominiant process occurring. However, as the flocs grow in size, shearing forces increase causing the flocs to breakup. Eventually this breakup balances the floc growth due to alum. As a result, flocs cannot continue to grow larger, and as a consequence residual turbidity stops decreasing.
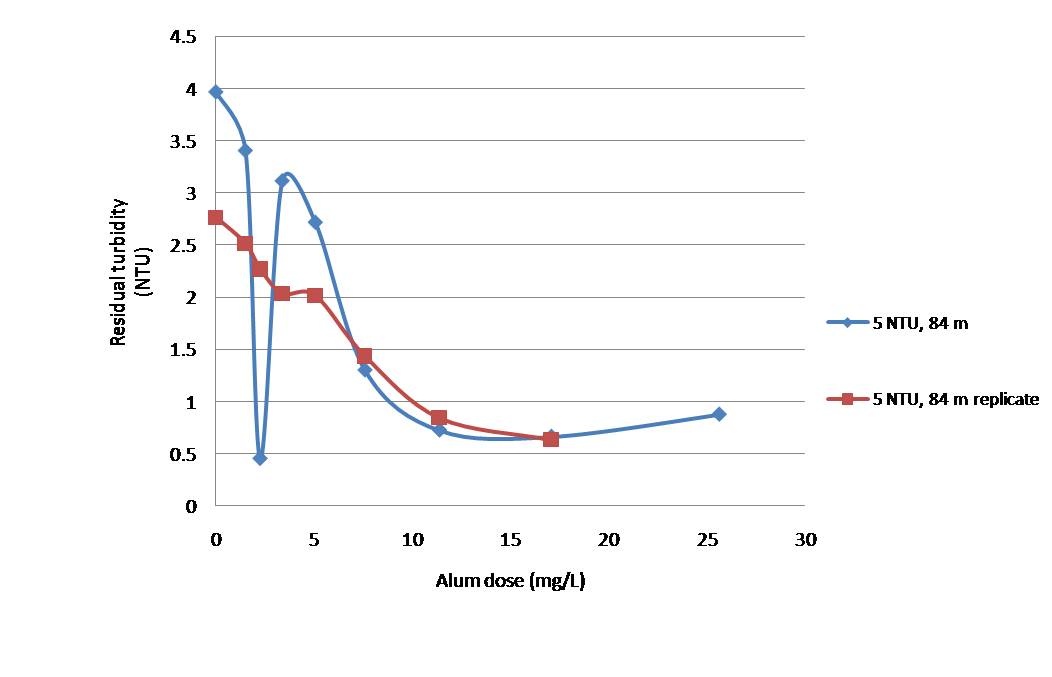
Figure 2: Residual turbidity vs. alum dose for 5 NTU influent water for a flocculator length of 8388cm, focusing on lower alum dosages.
For a flocculator length of 8388cm, we focused on the lower alum dosages to see how then residual turbidity plot developed; experiments with higher alum dosages tended to show relatively constant residual turbidities around the minimum value achieved with low dosages. Here we a similar trend to what was observed at 2796 cm, although the two replicates do not match as closely at the low end. We suspect this is due to limits in the calibration of the pumps, combined with the possibility of blockages in the alum line and variations in influent turbidity, making it difficult to achieve consistent results at such low alum dosages. 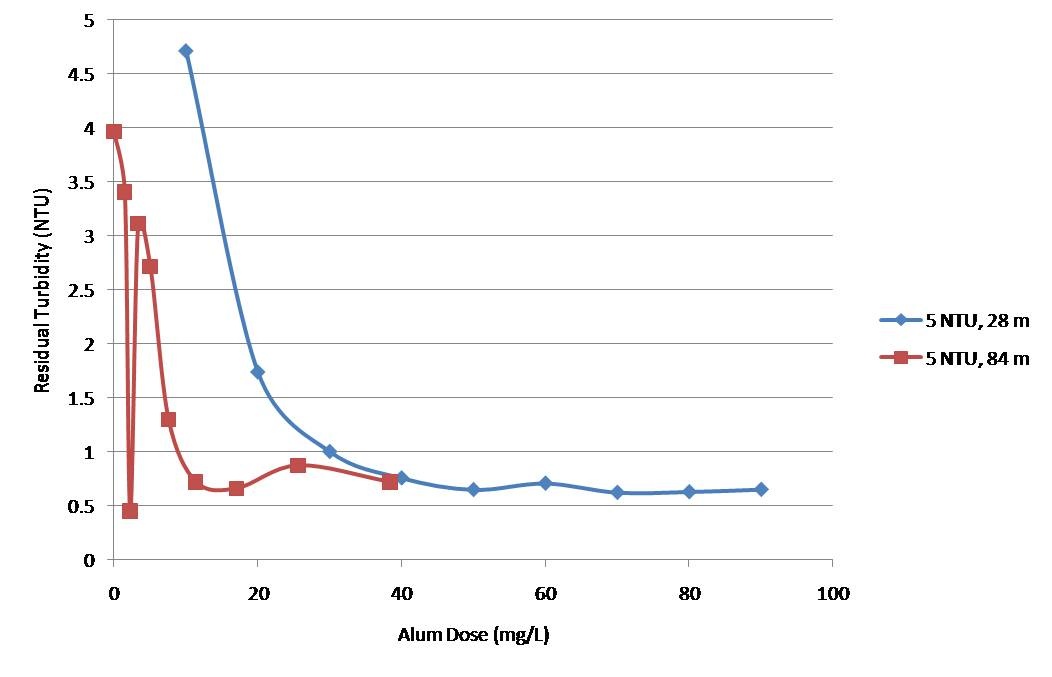
Figure 3: Comparison of residual turbidity vs. alum dose for two different flocculator lengths of 2796cm and 8388cm.
...
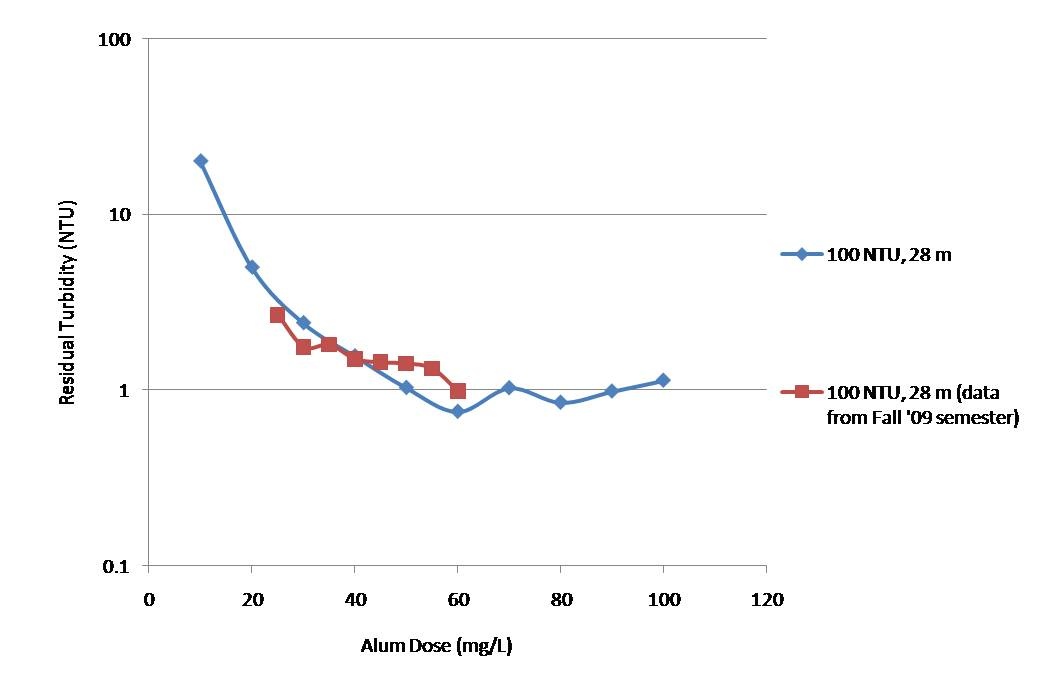
Figure 4: Residual turbidity vs. alum dose for 100 NTU influent water for a flocculator length of 2796cm. A logarithmic scale is used on the residual turbidity axis to show details of the minimum residual turbidity achieved.
Here we see a similar behavior to what was observed with 5 NTU influent water. The residual turbidity starts out high before approaching a minimum value. However, this minimum residual turbidity is higher than what was observed with 5 NTU water, being around 0.9-1 NTU.
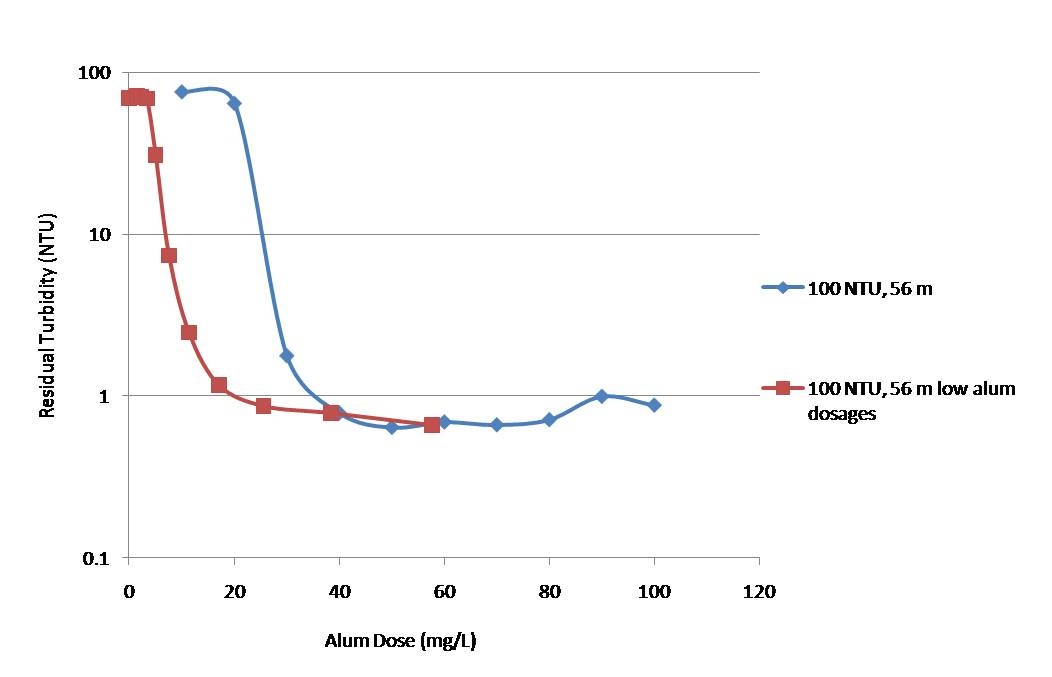
Figure 5: Residual turbidity vs. alum dose for 100 NTU influent water for a flocculator length of 5592cm. A logarithmic scale is used on the residual turbidity axis to show details of the minimum residual turbidity achieved.
Both replicates show the characteristic decay of residual turbidity to a limiting value. However, they do not agree at the low alum dosages; the second repliucate shows a much lower residual turbidty for comparable alum doses at the low end of the curve. We suspect that there may have been a blockage in the alum line during the first experiment resulting in this irregularity. This is because alum doses as high as 20 mg/L produced a residual turbidity of around 80 NTU, much higher than would be expected. We then hypothesize that the blockage cleared by the fourth data point in the second replicate, and as a result both replicates achieved similar limiting residual turbidities of around 0.8 NTU.
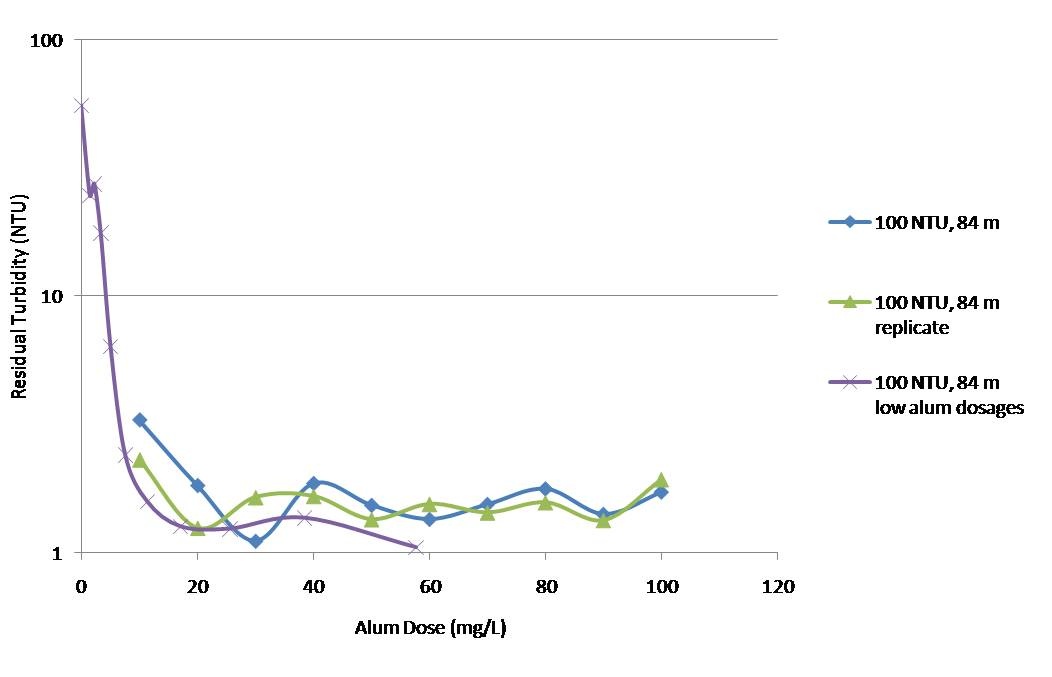
Figure 6: Residual turbidity vs. alum dose for 100 NTU influent water for a flocculator length of 5592cm. A logarithmic scale is used on the residual turbidity axis to show details of the minimum residual turbidity achieved.
All three replicates for a flocculator length of 8388 cm at 100 NTU show reasonable agreement, as well as the same characteristic decay of residual turbidity observed in previous experiments. However, the minimum residual turbidity achieved averaged around 1.6-2 NTU, significantly higher than observed at the previous two lengths. It appears that for a flocculator length of 8388cm, the floc breakup behavior becomes more dominant, resulting in elevated residual turbdities.
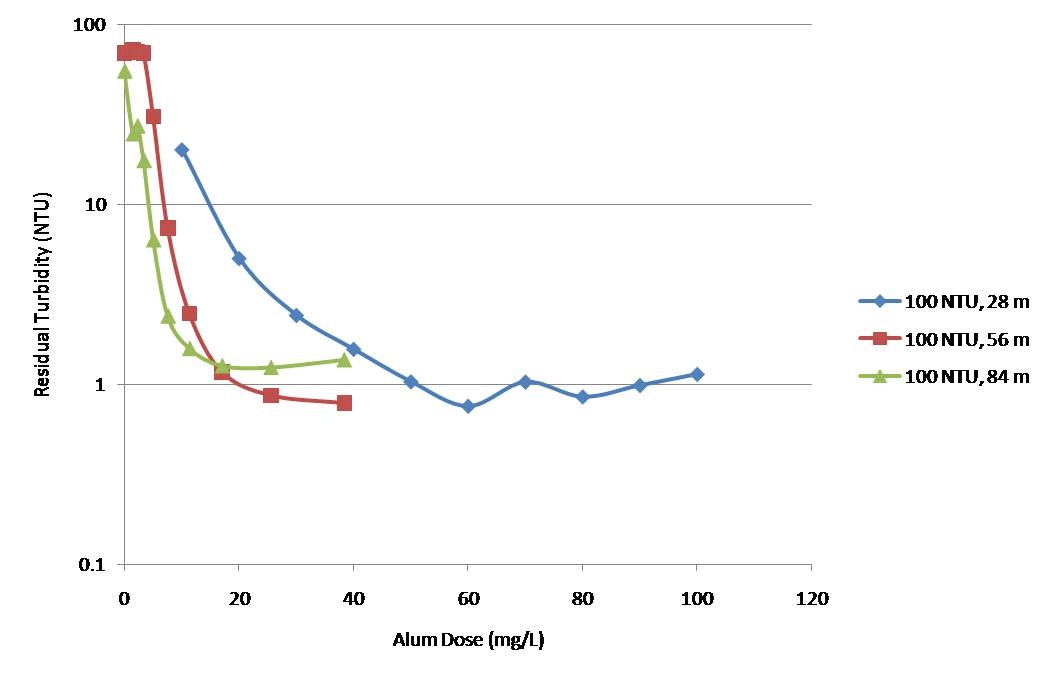
Figure 7: Comparison of residual turbidity vs. alum dose for three different flocculator lengths of 2796cm, 5592cm, and 8388cm with influent water at 100 NTU. A logarithmic scale is used on the residual turbidity axis to show details of the minimum residual turbidity achieved.
...
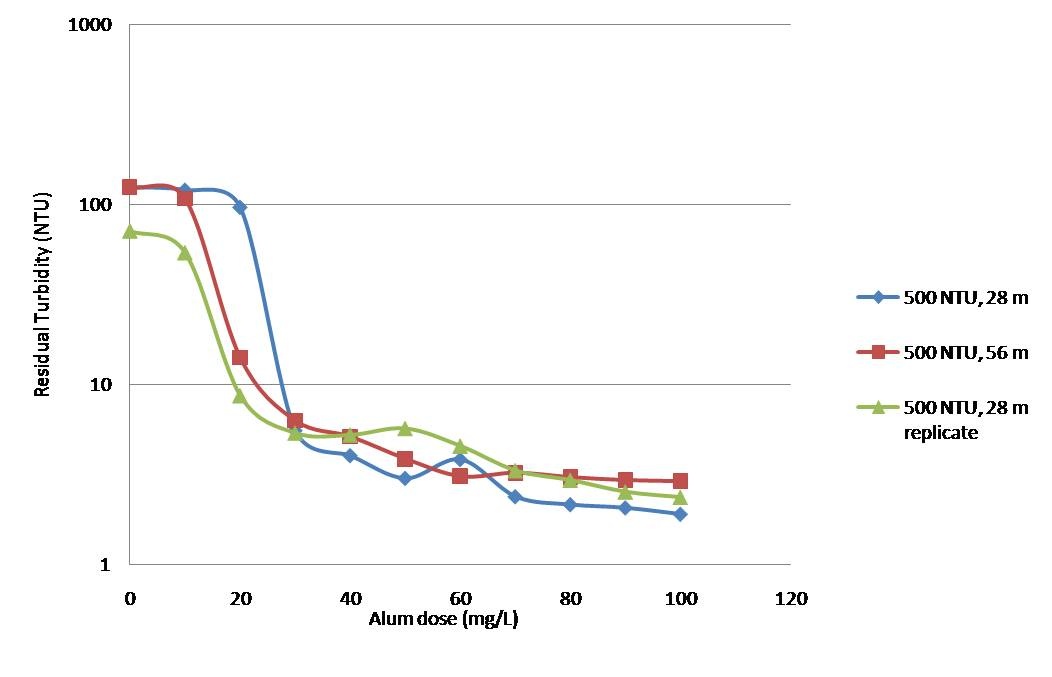
Figure 8: Comparison of residual turbidity vs. alum dose for two different flocculator lengths of 2796cm and 5592cm with influent water at 500 NTU.
...