*** This version of Confluence is for testing only and contains a copy of content from June 29th 2026. No changes will be preserved. ***

...
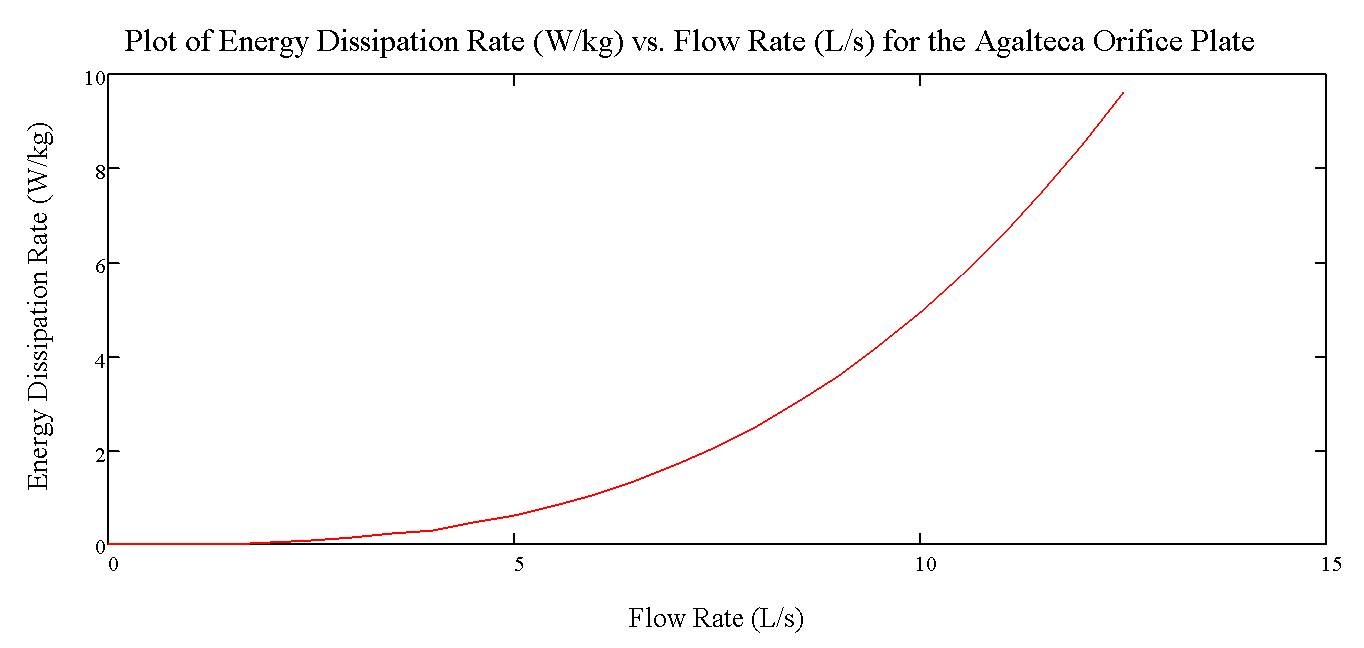
Because the flow rates through plant may vary based on the available source flow, we need to know how the energy dissipation rate will change with these changing flow rates. The following plot was generated in MathCAD to display how energy dissipation rates will change with varying flow rates through the orifice plate in place in Agalteca:
...