*** This version of Confluence is for testing only and contains a copy of content from June 29th 2026. No changes will be preserved. ***

...
The U and V displacement matrices were also run through a simple band pass filter that set a tolerance for upper and lower bounds of displacement and cut out background noise. Histograms of U and V data for each temperature data set were examined and upper and lower bounds were chosen based on visual inspection. If a data point appeared outside of these bounds, the data point was set to the mean value at that data point.
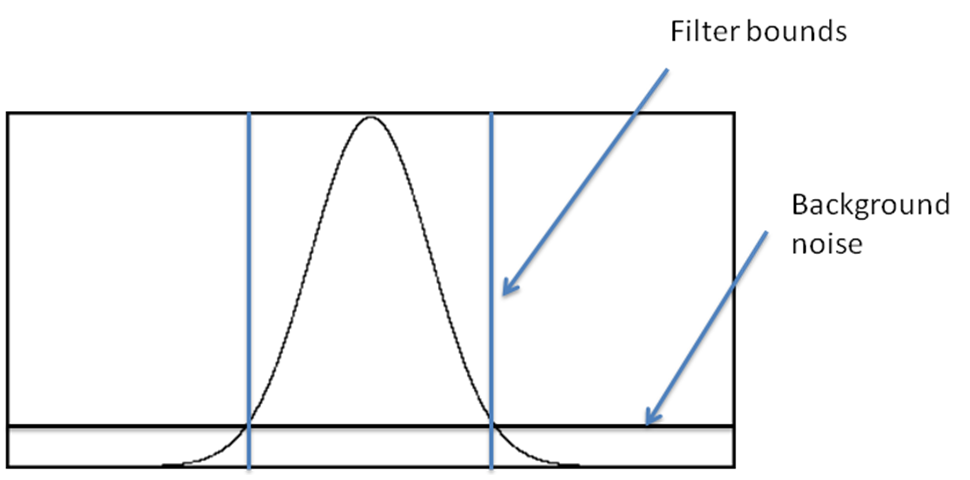
Figure 6 - Band Pass Filter schematic and generic Matlab code used to process the data.
...