*** This version of Confluence is for testing only and contains a copy of content from June 29th 2026. No changes will be preserved. ***

...
Figure 4 - Boiling time (minutes) vs. average water temperature (°C) for parallel cooking tests.
To further examine the difference in temperature verses time, figure 5 shows the different temperatures after 60 minutes of cooking in the form of a bar graph. The data shows that the difference between 1 and 2 pots of water is somewhat small---a difference of 3.3%. However, the drop in temperature increases somewhat drastically from 2 pots to 3 pots, after 60 minutes of cooking. It is important to note that this drop, nevertheless, is not a decrease in time per unit thermal mass of water. The data shows conclusively that the greater the thermal mass of water heated in parallel the greater the efficiency.
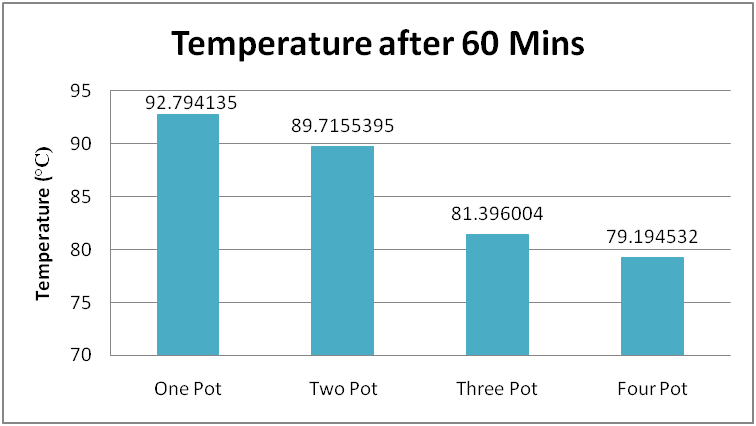
Figure 5--The difference in temperature reached after 60 minutes of cooking during the parallel heating tests.
...