*** This version of Confluence is for testing only and contains a copy of content from June 29th 2026. No changes will be preserved. ***

...
The figure below shows both the raw water turbidity and the effluent turbidity as a function of the flow rate. The effluent turbidity increases with the flow rate. This shows that filter performance decreases with increasing flow rates, meaning that in order to achieve a desirable effluent turbidity, a lower flow rate and thus a larger filter tank size must be employed. As show in the graph, filtration velocities of less than about 2 mm/s produce an effluent turbidity of less than one, or a pC* of greater than 0.9 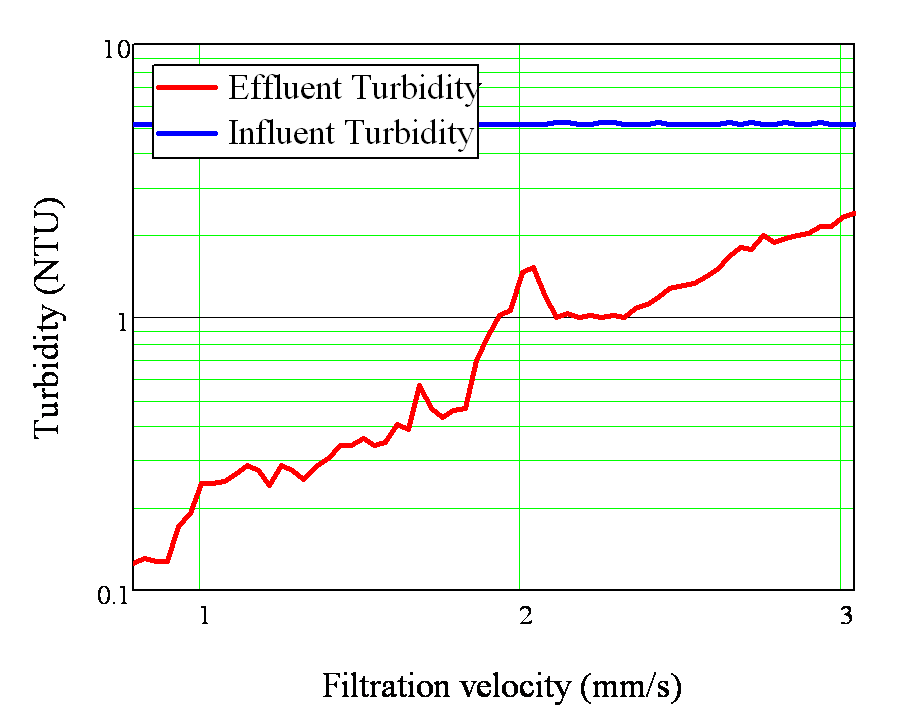
Figure 1: Raw Water and Effluent Turbidity vs Flow Rate 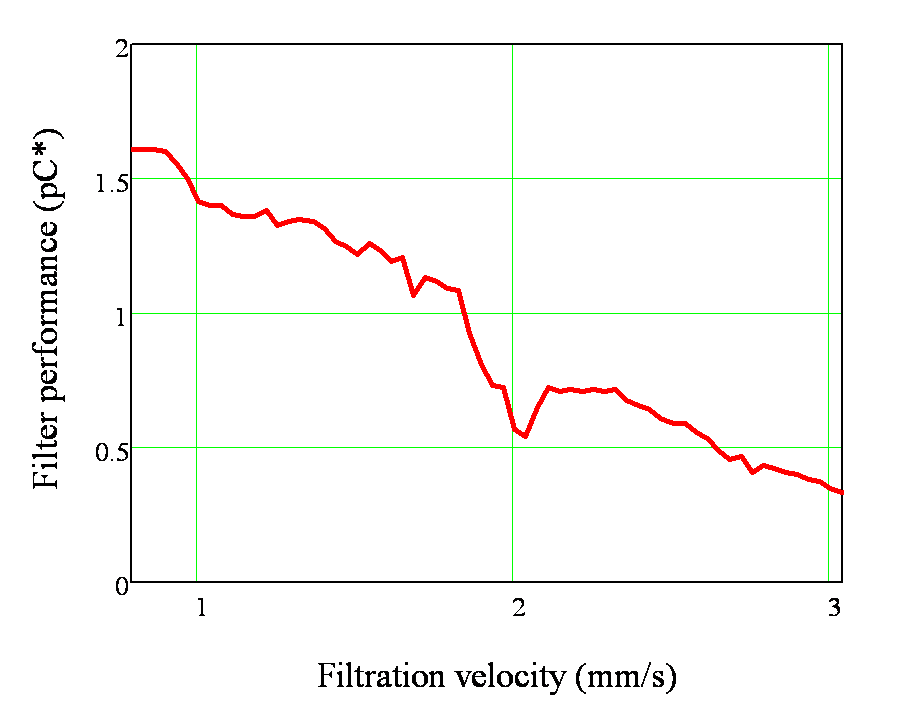
Figure 2: pC* vs Flow Rate
...
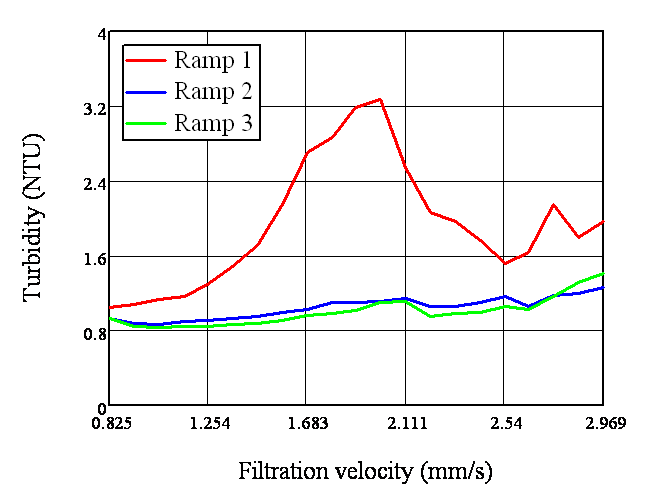
Figure 3 shows the three ramp states as a function of flow rate. The first ramp state has a significantly higher turbidity than the following two. This means that the layer of film on top of the foam sheets is affecting filter performance, and this needs to be considered when designing a filtration unit.